CollectD, InfluxDB and Grafana integration
09/09/2017 - LINUX
In this example, we are going to collect system stats with collectd and pass them to InfluxDB where they will be stored. We will then use Grafana to visualise stored data. We will be using collectD version 5.5.1, InfluxDB version 1.3.5 and Grafana version 4.4.3.
I assume that you already have InfluxDB and Grafana installed. If you want to know how to install them, you can read the previous post called "InfluxDB and Grafana integration" under LINUX category of this blog.
System setup
As shown below, I have two vagrant boxes setup as servers.
- Server 1 (192.168.50.20) - Where stats are collected and transferred to InfluxDB by collectd.
- Server 2 (192.168.99.30) - Where stats are stored by InfluxDB and visualised by Grafana.
Server 1 information
The server 1 must be able to communicate with the server 2 over UDP port 25826 which is what collectd will use to transfer data. Check if the communications is working. If it does work, you should see something like below.
server1:~$ sudo tcpdump -i eth0 -p -n dst port 25826
tcpdump: verbose output suppressed, use -v or -vv for full protocol decode
listening on eth0, link-type EN10MB (Ethernet), capture size 65535 bytes
10:52:34.138885 IP 10.0.2.15.34237 > 192.168.99.30.25826: UDP, length 1297
10:52:44.137505 IP 10.0.2.15.34237 > 192.168.99.30.25826: UDP, length 1319
10:52:54.138522 IP 10.0.2.15.34237 > 192.168.99.30.25826: UDP, length 1301
10:53:04.137666 IP 10.0.2.15.34237 > 192.168.99.30.25826: UDP, length 1298
InfluxDB
We first need to prepare InfluxDB in order to interact with collectd so do the following.
User authentication
Do the following to prevent unauthenticated access to database. We will create an admin user and let only admin user to access to database with username and password.
server-2:~$ influx
Connected to http://localhost:8086 version 1.3.5
InfluxDB shell version: 1.3.5
>
> CREATE USER inanzzz WITH PASSWORD '123123' WITH ALL PRIVILEGES
>
> SHOW USERS
user    admin
----    -----
inanzzz true
>
> EXIT
Look for auth-enabled in /etc/influxdb/influxdb.conf configuration file and set it as auth-enabled = true in order to enable authentication.
Restart the service.
server-2:~$ sudo service influxdb restart
Create database
server-2:~$ curl -i -XPOST http://localhost:8086/query -u inanzzz:123123 --data-urlencode "q=CREATE DATABASE collectd"
Verify database
server-2:~$ influx -username inanzzz -password 123123
Connected to http://localhost:8086 version 1.3.5
InfluxDB shell version: 1.3.5
>
> SHOW DATABASES
name: databases
name
----
_internal
collectd
>
Configuration for collectd
Find [[collectd]] in /etc/influxdb/influxdb.conf file and make it match settings below.
[[collectd]]
  enabled = true
  bind-address = ":25826"
  database = "collectd"
  retention-policy = ""
  typesdb = "/usr/local/share/collectd/types.db"
  batch-size = 5000
  batch-pending = 10
  batch-timeout = "10s"
  read-buffer = 0
Download types.db
server-2:~$ sudo mkdir /usr/local/share/collectd
server-2:~$ sudo wget -P /usr/local/share/collectd https://raw.githubusercontent.com/collectd/collectd/master/src/types.db
Restart InfluxDB
server-2:~$ sudo service influxdb stop
server-2:~$ sudo service influxdb start
CollectD
Information
CollectD is used to collect system metrics periodically and can send them to data storages such as InfluxDB etc. By default collectd monitors CPU, memory, interface, load and some others but you can configure it to monitor whatever you want it to monitor by using relevant plugins.
Installation
server-1:~$ sudo apt-get update
server-1:~$ sudo apt-get install collectd collectd-utils
server-1:~$ sudo service collectd status
Configuration
By default there are many plugins enabled but we will just watch cpu, disk, load, memory, processes, swap and users stats then disable remaining plugins.
Note: When you disable plugins, make sure to disable associated code blocks if there is any. For example df and rrdtool needs disabling.
server-1:~$ sudo nano /etc/collectd/collectd.conf

# Enable just these
LoadPlugin cpu
LoadPlugin disk
LoadPlugin load
LoadPlugin memory
LoadPlugin processes
LoadPlugin swap
LoadPlugin users
In addition to above, enable LoadPlugin network then add block below to the bottom of the page.
<Plugin "network">
    Server "192.168.99.30" "25826"
</Plugin>
Restart collectd
server-1:~$ sudo service influxdb restart
INFLUXDB
Let's just check what we have in collectd database.
server-2:~$ influx -username inanzzz -password 123123
Connected to http://localhost:8086 version 1.3.5
InfluxDB shell version: 1.3.5
>
> USE collectd
Using database collectd
>
> SHOW MEASUREMENTS
name: measurements
name
----
cpu_value
memory_value
>
>
> SELECT * FROM cpu_value LIMIT 5
name: cpu_value
time                host  instance type type_instance value
----                ----  -------- ---- ------------- -----
1504974634305158622 other 0        cpu  user          2711
1504974634305164974 other 0        cpu  nice          0
1504974634305167452 other 0        cpu  system        2448
1504974634305167969 other 0        cpu  idle          2227665
1504974634305168533 other 0        cpu  wait          372
>
> SELECT * FROM memory_value LIMIT 5
name: memory_value
time                host  type   type_instance value
----                ----  ----   ------------- -----
1504974634305230505 other memory used          190013440
1504974634305231222 other memory buffered      16171008
1504974634305231662 other memory cached        265412608
1504974634305232101 other memory free          42156032
1504974644301487467 other memory used          188911616
Grafana
Browse to http://192.168.99.30:3000 and login with admin:admin.
Add Data Source
- Click Grafana icon in the top header and select "Data Sources" option.
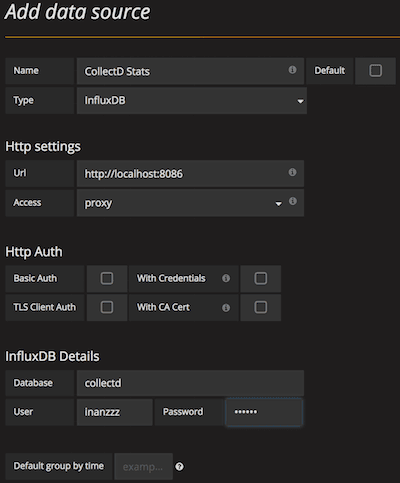
- Click "Add data source" button in the page.
- Fill the fields in as you see in the image below and click "Add" button.
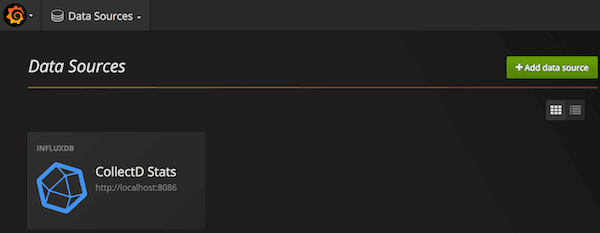
If you click Grafana icon in the top header and select "Data Sources", you should see image below.
Add Dashboard
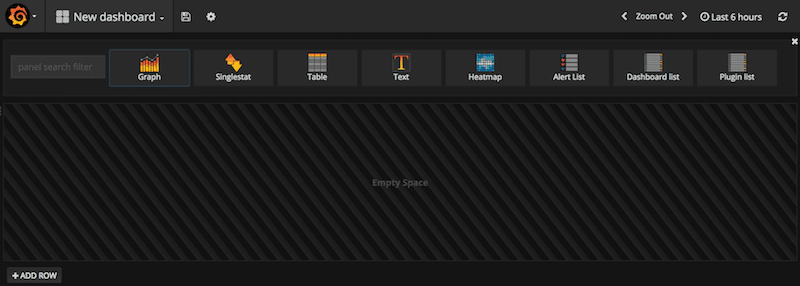
- Click Grafana icon in the top header, select "Dashboard" option then "New".
- Click "Graph" icon in the page.
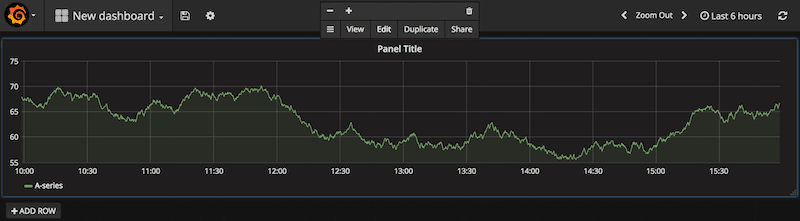
- Click "Panel Title" header of the graph and select "Edit".
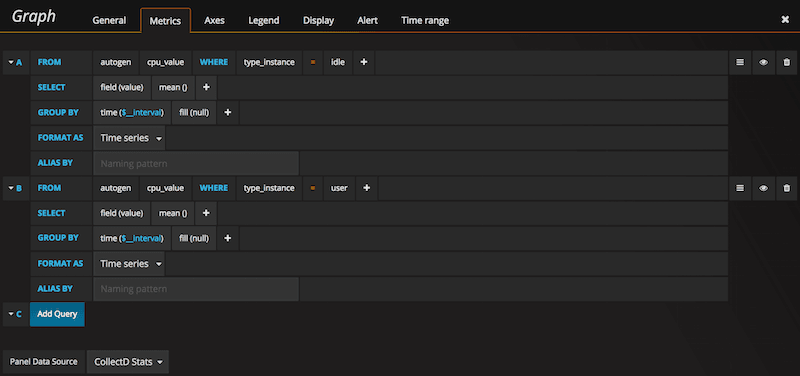
- Configure "Metrics" as seen image below.
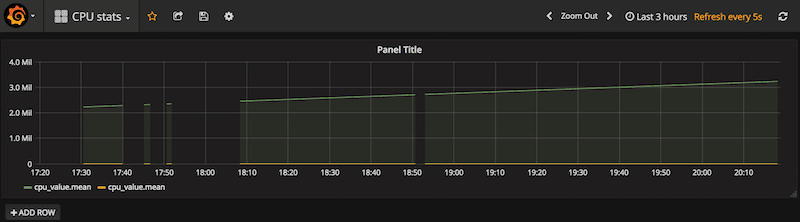
- Save it as "CPU stats" by clicking disk icon on top of the page. This will produce graph below.
Collectd links