Implementing OpenTelemetry and Jaeger tracing in Golang HTTP API
30/04/2021 - GO
In this example we are going to use OpenTelemetry and Jaeger to trace application request flow. The application is a basic Golang Rest API. I have created a simple trace package for you to use. It isolates some OpenTelemetry functions in order to simplify and standardise the usage throughout the application. Also the application is open for improvements by yourself which is not the main focus here!
OpenTelemetry standardises the way how telemetry data is collected and transferred. Jaeger allows us to export and visualise telemetry data. In our case, it is the HTTP request traces through a set of packages/files. This functionality allows us to pinpoint exact locations of failures or performance issues. See the basic flow below so the traces in the Jaeger UI make sense.
Flow
- User sends a HTTP request.
- Controller object catches it. (the parent span is created from the request context)
- Request object validates it. (the child span is created from the deferred context)
- Service object handles it. (the child span is created from the deferred context)
- Storage object stores it. (the child span is created from the deferred context)
- Controller responds to it.
Each span in each steps are closed/ended once their job is done.
Structure
├── cmd
│   └── client
│       └── main.go
├── docker
│   ├── docker-compose.yaml
│   └── dump.sql
└── internal
    ├── pkg
    │   ├── storage
    │   │   └── user.go
    │   └── trace
    │       ├── http.go
    │       ├── provider.go
    │       └── span.go
    └── users
        ├── controller.go
        ├── request.go
        └── service.go
Prerequisite
go get -u go.opentelemetry.io/otel
go get -u go.opentelemetry.io/otel/sdk
go get -u go.opentelemetry.io/contrib/instrumentation/net/http/otelhttp

go get -u go.opentelemetry.io/otel/exporters/trace/jaeger
Files
docker-compose.yaml
version: "3.4"

services:

  client-mysql:
    image: "mysql:5.7.24"
    container_name: client-mysql
    command:
      - "--character-set-server=utf8mb4"
      - "--collation-server=utf8mb4_unicode_ci"
    ports:
      - "3306:3306"
    environment:
      MYSQL_ROOT_PASSWORD: "root"
      MYSQL_DATABASE: "client"
      MYSQL_USER: "user"
      MYSQL_PASSWORD: "pass"
    volumes:
      - "./dump.sql:/docker-entrypoint-initdb.d/dump.sql"

  client-jaeger:
    image: jaegertracing/all-in-one:1.22.0
    container_name: client-jaeger
    ports:
      - "14268:14268"   # jaeger-collector HTTP server (tracer provider)
      - "16686:16686"   # HTTP server (browser UI)
dump.sql
CREATE TABLE IF NOT EXISTS `users` (
  `id` int(10) unsigned NOT NULL AUTO_INCREMENT,
  `name` varchar(255) COLLATE utf8mb4_unicode_ci NOT NULL,
  PRIMARY KEY (`id`)
) ENGINE=InnoDB DEFAULT CHARSET=utf8mb4 COLLATE=utf8mb4_unicode_ci;
main.go
package main

import (
	"context"
	"database/sql"
	"log"
	"net/http"

	"github.com/you/client/internal/pkg/storage"
	"github.com/you/client/internal/pkg/trace"
	"github.com/you/client/internal/users"

	_ "github.com/go-sql-driver/mysql"
)

func main() {
	ctx := context.Background()

	// Bootstrap tracer.
	prv, err := trace.NewProvider(trace.ProviderConfig{
		JaegerEndpoint: "http://localhost:14268/api/traces",
		ServiceName:    "client",
		ServiceVersion: "1.0.0",
		Environment:    "dev",
		Disabled:       false,
	})
	if err != nil {
		log.Fatalln(err)
	}
	defer prv.Close(ctx)

	// Bootstrap database.
	dtb, err := sql.Open("mysql", "user:pass@tcp(:3306)/client")
	if err != nil {
		log.Fatalln(err)
	}
	defer dtb.Close()

	// Bootstrap API.
	usr := users.New(storage.NewUserStorage(dtb))

	// Bootstrap HTTP router.
	rtr := http.DefaultServeMux
	rtr.HandleFunc("/api/v1/users", trace.HTTPHandlerFunc(usr.Create, "users_create"))

	// Start HTTP server.
	if err := http.ListenAndServe(":8080", rtr); err != nil {
		log.Fatalln(err)
	}
}
http.go
package trace

import (
	"net/http"

	"go.opentelemetry.io/contrib/instrumentation/net/http/otelhttp"
	"go.opentelemetry.io/otel"
)

// HTTPHandler is a convenience function which helps attaching tracing
// functionality to conventional HTTP handlers.
func HTTPHandler(handler http.Handler, name string) http.Handler {
	return otelhttp.NewHandler(handler, name, otelhttp.WithTracerProvider(otel.GetTracerProvider()))
}

// HTTPHandlerFunc is a convenience function which helps attaching tracing
// functionality to conventional HTTP handlers.
func HTTPHandlerFunc(handler http.HandlerFunc, name string) http.HandlerFunc {
	return otelhttp.NewHandler(handler, name, otelhttp.WithTracerProvider(otel.GetTracerProvider())).ServeHTTP
}
provider.go
package trace

import (
	"context"

	"go.opentelemetry.io/otel"
	"go.opentelemetry.io/otel/exporters/trace/jaeger"
	"go.opentelemetry.io/otel/propagation"
	"go.opentelemetry.io/otel/semconv"
	"go.opentelemetry.io/otel/trace"

	sdkresource "go.opentelemetry.io/otel/sdk/resource"
	sdktrace "go.opentelemetry.io/otel/sdk/trace"
)

// ProviderConfig represents the provider configuration and used to create a new
// `Provider` type.
type ProviderConfig struct {
	JaegerEndpoint string
	ServiceName    string
	ServiceVersion string
	Environment    string
	// Set this to `true` if you want to disable tracing completly.
	Disabled bool
}

// Provider represents the tracer provider. Depending on the `config.Disabled`
// parameter, it will either use a "live" provider or a "no operations" version.
// The "no operations" means, tracing will be globally disabled.
type Provider struct {
	provider trace.TracerProvider
}

// New returns a new `Provider` type. It uses Jaeger exporter and globally sets
// the tracer provider as well as the global tracer for spans.
func NewProvider(config ProviderConfig) (Provider, error) {
	if config.Disabled {
		return Provider{provider: trace.NewNoopTracerProvider()}, nil
	}

	exp, err := jaeger.NewRawExporter(
		jaeger.WithCollectorEndpoint(jaeger.WithEndpoint(config.JaegerEndpoint)),
	)
	if err != nil {
		return Provider{}, err
	}

	prv := sdktrace.NewTracerProvider(
		sdktrace.WithBatcher(exp),
		sdktrace.WithResource(sdkresource.NewWithAttributes(
			semconv.ServiceNameKey.String(config.ServiceName),
			semconv.ServiceVersionKey.String(config.ServiceVersion),
			semconv.DeploymentEnvironmentKey.String(config.Environment),
		)),
	)

	otel.SetTracerProvider(prv)
	otel.SetTextMapPropagator(propagation.NewCompositeTextMapPropagator(
		propagation.TraceContext{},
		propagation.Baggage{},
	))

	tracer = struct{ trace.Tracer }{otel.Tracer(config.ServiceName)}

	return Provider{provider: prv}, nil
}

// Close shuts down the tracer provider only if it was not "no operations"
// version.
func (p Provider) Close(ctx context.Context) error {
	if prv, ok := p.provider.(*sdktrace.TracerProvider); ok {
		return prv.Shutdown(ctx)
	}

	return nil
}
span.go
You probably have noticed that I am using the same global tracer for each span. However, you can create a new tracer for each span if you wish. All depends on your application needs.
package trace

import (
	"context"

	"go.opentelemetry.io/otel"
	"go.opentelemetry.io/otel/attribute"
	"go.opentelemetry.io/otel/codes"
	"go.opentelemetry.io/otel/trace"
)

// NewSpan returns a new span from the global tracer. Depending on the `cus`
// argument, the span is either a plain one or a customised one. Each resulting
// span must be completed with `defer span.End()` right after the call.
func NewSpan(ctx context.Context, name string, cus SpanCustomiser) (context.Context, trace.Span) {
	if cus == nil {
		return otel.Tracer("").Start(ctx, name)
	}

	return otel.Tracer("").Start(ctx, name, cus.customise()...)
}

// SpanFromContext returns the current span from a context. If you wish to avoid
// creating child spans for each operation and just rely on the parent span, use
// this function throughout the application. With such practise you will get
// flatter span tree as opposed to deeper version. You can always mix and match
// both functions.
func SpanFromContext(ctx context.Context) trace.Span {
	return trace.SpanFromContext(ctx)
}

// AddSpanTags adds a new tags to the span. It will appear under "Tags" section
// of the selected span. Use this if you think the tag and its value could be
// useful while debugging.
func AddSpanTags(span trace.Span, tags map[string]string) {
	list := make([]attribute.KeyValue, len(tags))

	var i int
	for k, v := range tags {
		list[i] = attribute.Key(k).String(v)
		i++
	}

	span.SetAttributes(list...)
}

// AddSpanEvents adds a new events to the span. It will appear under the "Logs"
// section of the selected span. Use this if the event could mean anything
// valuable while debugging.
func AddSpanEvents(span trace.Span, name string, events map[string]string) {
	list := make([]trace.EventOption, len(events))

	var i int
	for k, v := range events {
		list[i] = trace.WithAttributes(attribute.Key(k).String(v))
		i++
	}

	span.AddEvent(name, list...)
}

// AddSpanError adds a new event to the span. It will appear under the "Logs"
// section of the selected span. This is not going to flag the span as "failed".
// Use this if you think you should log any exceptions such as critical, error,
// warning, caution etc. Avoid logging sensitive data!
func AddSpanError(span trace.Span, err error) {
	span.RecordError(err)
}

// FailSpan flags the span as "failed" and adds "error" label on listed trace.
// Use this after calling the `AddSpanError` function so that there is some sort
// of relevant exception logged against it.
func FailSpan(span trace.Span, msg string) {
	span.SetStatus(codes.Error, msg)
}

// SpanCustomiser is used to enforce custom span options. Any custom concrete
// span customiser type must implement this interface.
type SpanCustomiser interface {
	customise() []trace.SpanOption
}
user.go
package storage

import (
	"context"
	"database/sql"
	"fmt"
	"log"
	"time"

	"github.com/you/client/internal/pkg/trace"
)

type UserStorer interface {
	Insert(ctx context.Context, user User) error
}

type User struct {
	ID   int
	Name string
}

var _ UserStorer = UserStorage{}

type UserStorage struct {
	database *sql.DB
}

func NewUserStorage(dtb *sql.DB) UserStorage {
	return UserStorage{
		database: dtb,
	}
}

func (u UserStorage) Insert(ctx context.Context, user User) error {
	// Create a child span.
	ctx, span := trace.NewSpan(ctx, "UserStorage.Insert", nil)
	defer span.End()

	ctx, cancel := context.WithTimeout(ctx, time.Second*10)
	defer cancel()

	if _, err := u.database.ExecContext(ctx, `INSERT INTO users (name) VALUES (?)`, user.Name); err != nil {
		log.Println(err)

		return fmt.Errorf("insert: failed to execute query")
	}

	return nil
}
controller.go
package users

import (
	"log"
	"net/http"

	"github.com/you/client/internal/pkg/storage"
	"github.com/you/client/internal/pkg/trace"
)

type Controller struct {
	service service
}

func New(storage storage.UserStorer) Controller {
	return Controller{
		service: service{
			storage: storage,
		},
	}
}

func (c Controller) Create(w http.ResponseWriter, r *http.Request) {
	// You could actually use `trace.SpanFromContext` here instead!

	// Create the parent span.
	ctx, span := trace.NewSpan(r.Context(), "Controller.Create", nil)
	defer span.End()

	// Some random informative tags.
	trace.AddSpanTags(span, map[string]string{"app.tag_1": "val_1", "app.tag_2": "val_2"})

	// Some random informative event.
	trace.AddSpanEvents(span, "test", map[string]string{"event_1": "val_1", "event_2": "val_2"})

	req := &createRequest{}
	if err := req.validate(ctx, r.Body); err != nil {
		// Logging error on span but not marking it as "failed".
		trace.AddSpanError(span, err)

		log.Println(err)
		w.WriteHeader(http.StatusBadRequest)
		return
	}

	if err := c.service.create(ctx, req); err != nil {
		// Logging error on span and marking it as "failed".
		trace.AddSpanError(span, err)
		trace.FailSpan(span, "internal error")

		log.Println(err)
		w.WriteHeader(http.StatusInternalServerError)
		return
	}

	w.WriteHeader(http.StatusCreated)
}
request.go
package users

import (
	"context"
	"encoding/json"
	"fmt"
	"io"

	"github.com/you/client/internal/pkg/trace"
)

type createRequest struct {
	Name string `json:"name"`
}

func (c *createRequest) validate(ctx context.Context, body io.Reader) error {
	// Create a child span.
	_, span := trace.NewSpan(ctx, "createRequest.validate", nil)
	defer span.End()

	if err := json.NewDecoder(body).Decode(c); err != nil {
		return fmt.Errorf("validate: malformed body")
	}

	if c.Name == "" {
		return fmt.Errorf("validate: invalid request")
	}

	return nil
}
service.go
package users

import (
	"context"
	"fmt"

	"github.com/you/client/internal/pkg/storage"
	"github.com/you/client/internal/pkg/trace"
)

type service struct {
	storage storage.UserStorer
}

func (s service) create(ctx context.Context, req *createRequest) error {
	// Create a child span.
	ctx, span := trace.NewSpan(ctx, "service.create", nil)
	defer span.End()

	if err := s.storage.Insert(ctx, storage.User{Name: req.Name}); err != nil {
		return fmt.Errorf("create: unable to store: %w", err)
	}

	return nil
}
Test
Make sure you have run your docker containers and the go application first. You can access Jaeger from http://localhost:16686/ and the application from http://localhost:8080/api/v1/users address. At first you are not going to see any trace or service in Jaeger UI.
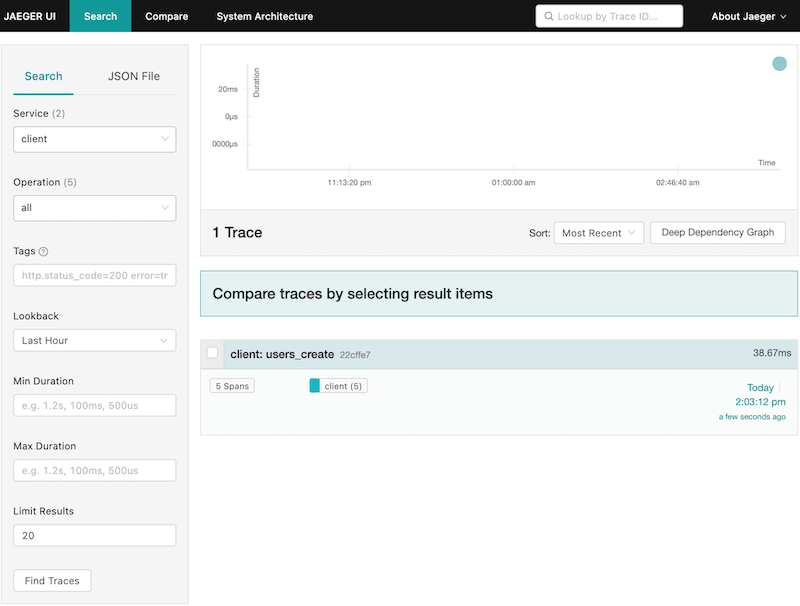
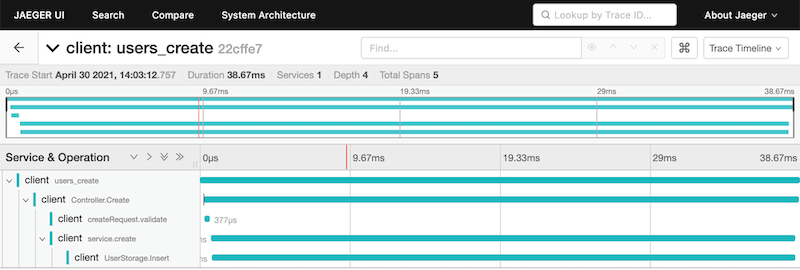
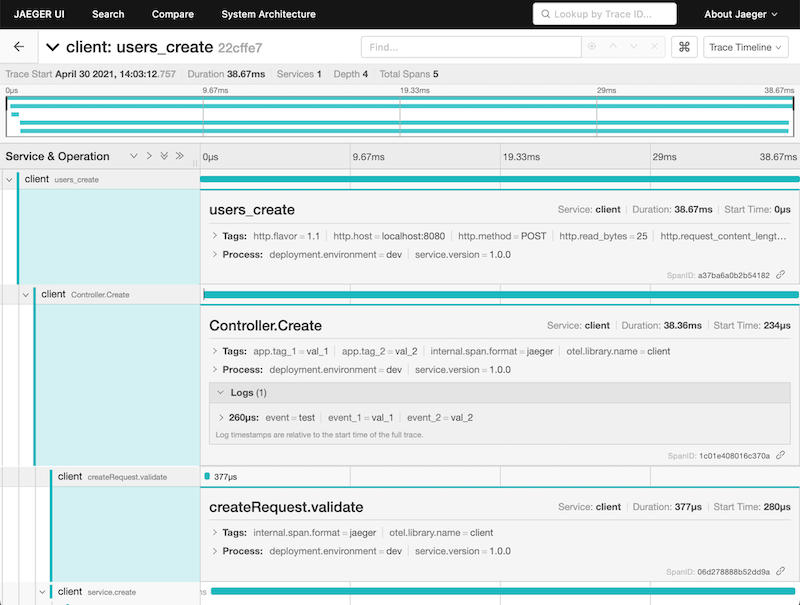
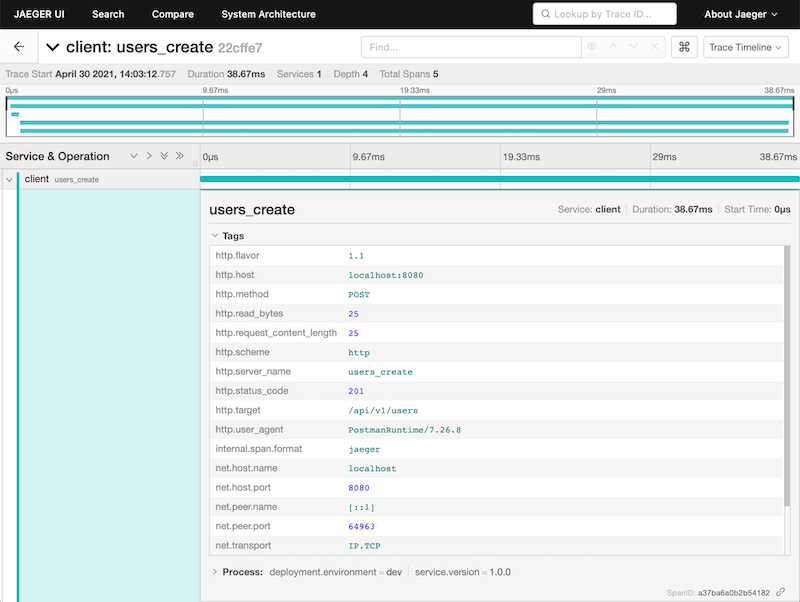
A valid request
You have sent a valid HTTP request and all went fine. This is what you would get.
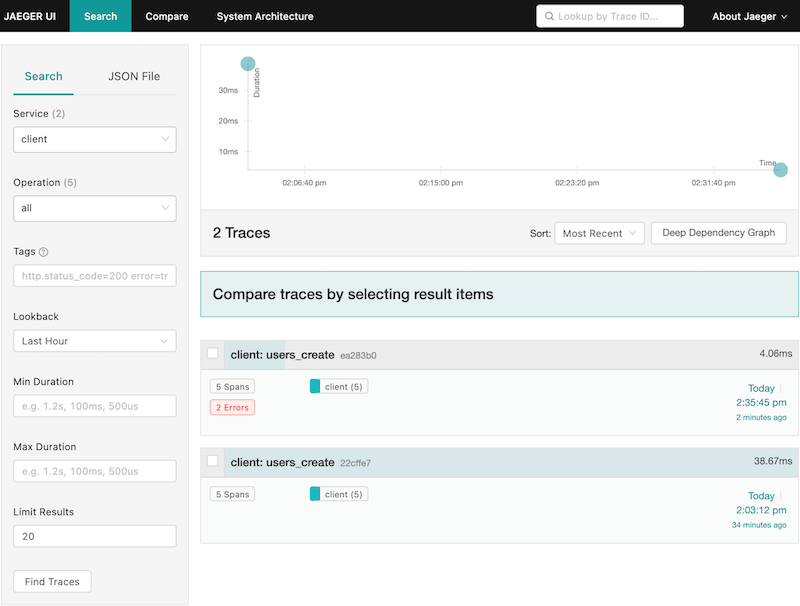
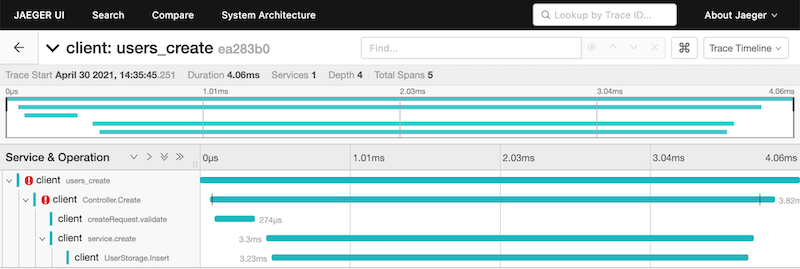
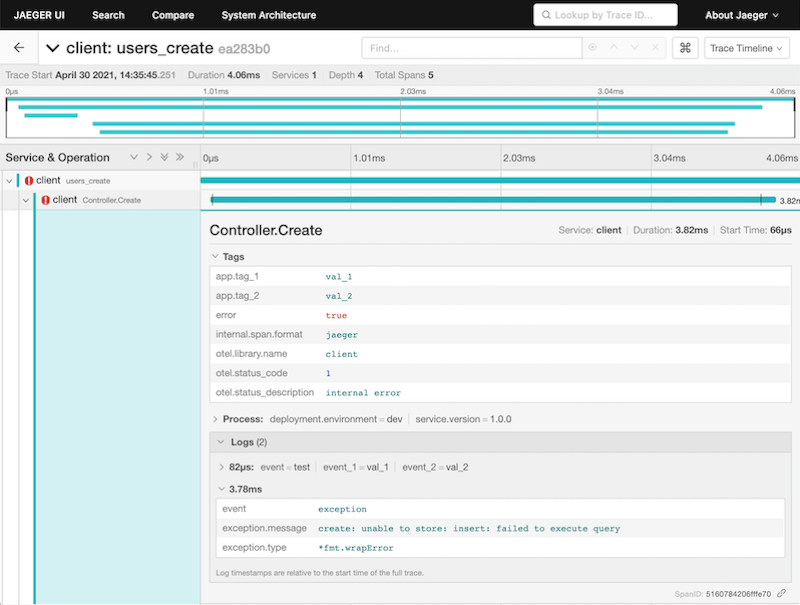
An invalid 500 request
I purposely renamed field name in database so the storage/user.go file would return an error. This would help me to log an error on the span. Note: Although I am doing most of the things in the controller.go for the sake of demonstration purposes, you should actually use some of those trace functions in relevant objects/files. For example, you would need to use AddSpanError&FailSpan functions in the storage file, not the controller file. You would have more relevant error message and data in Jaeger.