Using Prometheus metrics in Golang and creating Grafana dashboard
25/09/2020 - DOCKER, GO
We are going to use Prometheus to collect Golang application metrics. It includes counter, gauge and histogram metric types. Once we have the metrics, we will create a Grafana dashboard to visualise them.
In example below, I am going to collect metrics manually in my controller just to keep the post as short as possible. However, this is not maintainable in the real world example. The ideal solution is to create middleware for each metrics to avoid code duplications.
Assume that we are a bank and collecting clients' balance related metrics. Our metrics are consist of:
- HTTP response code counter. e.g. 200, 400 ...
- Balance activity counter. e.g. gone up or down.
- Current balance.
- Response duration in milliseconds.
Prerequisites
Run go get github.com/prometheus/client_golang/prometheus to install Prometheus package.
Structure
When you bring up docker containers you will be able to access Prometheus UI from http://localhost:9090/graph and Graphana UI from http://localhost:3000/ (admin:admin).
├── Makefile
├── build
│   └── dev
│       ├── docker-compose.yaml
│       ├── go
│       │   └── Dockerfile
│       └── prometheus
│           └── prometheus.yml
├── cmd
│   └── client
│       └── main.go
├── go.mod
├── internal
│   ├── controller
│   │   └── balance_update.go
│   └── pkg
│       ├── metric
│       │   ├── counter.go
│       │   ├── gauge.go
│       │   ├── historgam.go
│       │   └── metric.go
│       └── prometheus
│           └── prometheus.go
└── tmp
Files
Makefile
.PHONY: docker-up
docker-up:
	docker-compose -f build/dev/docker-compose.yaml up --build

.PHONY: docker-down
docker-down:
	docker-compose -f build/dev/docker-compose.yaml down
	docker system prune --volumes --force
build/dev/go/Dockerfile
# STAGE 1: build
FROM golang:1.13.1-alpine3.10 as build

WORKDIR /source

COPY . .

RUN CGO_ENABLED=0 go build -ldflags "-s -w" -o bin/client -v cmd/client/main.go

# STAGE 2: run
FROM alpine:3.10 as run

COPY --from=build /source/bin/client /client

ENTRYPOINT ["/client"]
build/dev/prometheus/prometheus.yml
scrape_configs:
  - job_name: client
    scrape_interval: 15s
    metrics_path: /metrics
    static_configs:
      - targets:
        - go:8080
build/dev/docker-compose.yaml
version: "3.4"

services:

  go:
    build:
      context: "../.."
      dockerfile: "build/dev/go/Dockerfile"
    ports:
      - "8080:8080"

  prometheus:
    image: "prom/prometheus:v2.21.0"
    ports:
      - "9090:9090"
    command:
      - "--config.file=/etc/prometheus/prometheus.yml"
    volumes:
      - "./prometheus/prometheus.yml:/etc/prometheus/prometheus.yml:ro"

  grafana:
    image: "grafana/grafana:5.4.3"
    ports:
      - "3000:3000"
    volumes:
      - "../../tmp/build/grafana:/var/lib/grafana:cached"
cmd/client/main.go
package main

import (
	"log"
	"net/http"

	"github.com/inanzzz/client/internal/controller"
	"github.com/inanzzz/client/internal/pkg/metric"
	"github.com/inanzzz/client/internal/pkg/prometheus"
)

func main() {
	log.Println("server running on :8080")

	// Prometheus
	pro := prometheus.New(true)

	// Metric
	mtr := metric.New(pro.Registry())

	// Router
	rtr := http.NewServeMux()
	rtr.HandleFunc("/metrics", pro.Handler())
	rtr.HandleFunc("/api/v1/balances", controller.NewBalanceUpdate(mtr).Handle)

	// Server
	log.Fatalln(http.ListenAndServe(":8080", rtr))
}
internal/controller/balance_update.go
package controller

import (
	"fmt"
	"math/rand"
	"net/http"
	"strconv"
	"time"

	"github.com/inanzzz/client/internal/pkg/metric"
)

var (
	codes = []int{
		http.StatusOK,
		http.StatusCreated,
		http.StatusBadRequest,
		http.StatusNotFound,
		http.StatusInternalServerError,
		http.StatusServiceUnavailable,
	}
	clients   = []string{"client_1", "client_2", "client_3"}
	amounts   = []string{"5.51", "-2.02", "14.00", "-17.00", "71.17", "-59.01", "9.99", "-19.55", "0.00"}
	durations = []int{32, 43, 55, 67, 76, 88, 99, 101, 106, 109, 111, 120, 131, 135, 148, 160, 180, 203, 210, 211}
)

type BalanceUpdate struct {
	metric metric.Metric
}

func NewBalanceUpdate(metric metric.Metric) BalanceUpdate {
	return BalanceUpdate{
		metric: metric,
	}
}

func (b BalanceUpdate) Handle(w http.ResponseWriter, r *http.Request) {
	rand.Seed(time.Now().UnixNano())

	// Used for histogram.
	start := time.Now()

	// Randomly pick a client.
	client := clients[rand.Intn(len(clients))]

	// Randomly decide how long it would take to respond.
	duration := durations[rand.Intn(len(durations))]

	time.Sleep(time.Duration(duration) * time.Millisecond)

	// Randomly decide what response code we would return.
	code := codes[rand.Intn(len(codes))]

	if code != http.StatusOK {
		b.metric.HTTPResponseCounter.WithLabelValues("balance_update", fmt.Sprintf("%d", code)).Inc()
		dur := float64(time.Since(start).Milliseconds())
		b.metric.ResponseDurationHistogram.WithLabelValues("balance_update").Observe(dur)
		dump(code, dur, "n/a", client)
		return
	}

	// Randomly decide what amount would go in/out of balance.
	amount := amounts[rand.Intn(len(amounts))]

	if amount[0:1] == "-" {
		a, _ := strconv.ParseFloat(amount[1:], 64)
		b.metric.BalanceGauge.Sub(a)
		b.metric.BalanceActivityCounter.WithLabelValues("down", client).Inc()
	} else {
		a, _ := strconv.ParseFloat(amount, 64)
		b.metric.BalanceGauge.Add(a)
		b.metric.BalanceActivityCounter.WithLabelValues("up", client).Inc()
	}

	b.metric.HTTPResponseCounter.WithLabelValues("balance_update", fmt.Sprintf("%d", code)).Inc()
	dur := float64(time.Since(start).Milliseconds())
	b.metric.ResponseDurationHistogram.WithLabelValues("balance_update").Observe(dur)
	dump(code, dur, amount, client)
}

func dump(code int, dur float64, amount string, client string) {
	fmt.Println("CODE:", code, "AMOUNT:", amount, "DURATION:", dur, "CLIENT:", client)
}
internal/pkg/metric/counter.go
A counter is a cumulative metric that represents a single numerical counter whose value can only increase.
package metric

import (
	"github.com/prometheus/client_golang/prometheus"
)

func httpResponseCounter() *prometheus.CounterVec {
	return prometheus.NewCounterVec(prometheus.CounterOpts{
		Namespace: "client",
		Name:      "http_response_counter",
		Help:      "Number of HTTP responses",
	}, []string{"operation", "code"})
}

func balanceActivityCounter() *prometheus.CounterVec {
	return prometheus.NewCounterVec(prometheus.CounterOpts{
		Namespace: "client",
		Name:      "balance_activity_counter",
		Help:      "Balance activity history",
	}, []string{"activity", "client"})
}
internal/pkg/metric/gauge.go
A gauge is a metric that represents a single numerical value that can go up and down. It is the simplest metric available in Prometheus.
package metric

import (
	"github.com/prometheus/client_golang/prometheus"
)

func balanceGauge() prometheus.Gauge {
	return prometheus.NewGauge(prometheus.GaugeOpts{
		Namespace: "client",
		Name:      "balance_gauge",
		Help:      "Current balance",
	})
}
internal/pkg/metric/historgam.go
A histogram samples observations (usually things like request/response durations/sizes) and counts them in configurable buckets. It also provides a sum of all observed values.
package metric

import (
	"github.com/prometheus/client_golang/prometheus"
)

// Here we assume that our balance endpoint usually take between
// 30~220ms and we design our buckets accordingly.
func responseDurationHistogram() *prometheus.HistogramVec {
	return prometheus.NewHistogramVec(prometheus.HistogramOpts{
		Namespace: "client",
		Name:      "balance_response_duration_histogram",
		Help:      "Balance response duration (ms)",
		Buckets:   []float64{10, 50, 90, 130, 170, 210, 250, 290, 330},
		// This is same as prometheus.LinearBuckets(10, 40, 9)
		// 9 buckets starting from 10 increased by 40
	}, []string{"operation"})
}

// Another example:
// 4 buckets starting from 1 multiplied by 3 between. e.g. 1, 3, 9, 27
// prometheus.ExponentialBuckets(1, 3, 9)
internal/pkg/metric/metric.go
package metric

import (
	"github.com/prometheus/client_golang/prometheus"
)

type Metric struct {
	HTTPResponseCounter       *prometheus.CounterVec
	BalanceActivityCounter    *prometheus.CounterVec
	BalanceGauge              prometheus.Gauge
	ResponseDurationHistogram *prometheus.HistogramVec
}

func New(registry *prometheus.Registry) Metric {
	m := &Metric{}

	m.HTTPResponseCounter = httpResponseCounter()
	registry.MustRegister(m.HTTPResponseCounter)
	m.BalanceActivityCounter = balanceActivityCounter()
	registry.MustRegister(m.BalanceActivityCounter)

	m.BalanceGauge = balanceGauge()
	registry.MustRegister(m.BalanceGauge)

	m.ResponseDurationHistogram = responseDurationHistogram()
	registry.MustRegister(m.ResponseDurationHistogram)

	return *m
}
internal/pkg/prometheus/prometheus.go
package prometheus

import (
	"net/http"

	"github.com/prometheus/client_golang/prometheus"
	"github.com/prometheus/client_golang/prometheus/promhttp"
)

type Prometheus struct {
	registry *prometheus.Registry
	handler  http.HandlerFunc
}

// New returns a new `Metric` instance. The `custom` helps keeping or discarding
// all the built-in default metrics. If you just want to see your custom metrics
// set it to `true`.
func New(custom bool) Prometheus {
	reg := prometheus.NewRegistry()

	if custom {
		return Prometheus{
			registry: reg,
			handler: func(w http.ResponseWriter, r *http.Request) {
				promhttp.HandlerFor(reg, promhttp.HandlerOpts{}).ServeHTTP(w, r)
			},
		}

	} else {
		return Prometheus{
			registry: reg,
			handler: func(w http.ResponseWriter, r *http.Request) {
				promhttp.Handler().ServeHTTP(w, r)
			},
		}
	}
}

// Handler returns HTTP handler.
func (p Prometheus) Handler() http.HandlerFunc {
	return p.handler
}

// Registry returns `Registry` instance which helps registering the custom metric collectors.
func (p Prometheus) Registry() *prometheus.Registry {
	return p.registry
}
Test
If you call command below, it will generate metrics for you. Visit http://localhost:8080/metrics to list metrics.
for ((i=1;i<=100;i++)); do curl "http://localhost:8080/api/v1/balances"; done
We should have metrics look like the ones below.
# HELP client_http_response_counter Number of HTTP responses
# TYPE client_http_response_counter counter
client_http_response_counter{code="200",operation="balance_update"} 1
client_http_response_counter{code="400",operation="balance_update"} 1
client_http_response_counter{code="404",operation="balance_update"} 3

# HELP client_balance_activity_counter Balance activity history
# TYPE client_balance_activity_counter counter
client_balance_activity_counter{activity="down",client="client_1"} 1
client_balance_activity_counter{activity="down",client="client_2"} 5
client_balance_activity_counter{activity="down",client="client_3"} 6
client_balance_activity_counter{activity="up",client="client_1"} 9
client_balance_activity_counter{activity="up",client="client_2"} 7
client_balance_activity_counter{activity="up",client="client_3"} 7
# HELP client_balance_gauge Current balance
# TYPE client_balance_gauge gauge
client_balance_gauge -177.59000000000015
If there is only one request and the response takes 120ms then the result would look like the one below.
# HELP client_balance_response_duration_histogram Balance response duration (ms)
# TYPE client_balance_response_duration_histogram histogram
client_balance_response_duration_histogram_bucket{operation="balance_update",le="10"} 0
client_balance_response_duration_histogram_bucket{operation="balance_update",le="50"} 0
client_balance_response_duration_histogram_bucket{operation="balance_update",le="90"} 0
client_balance_response_duration_histogram_bucket{operation="balance_update",le="130"} 1
client_balance_response_duration_histogram_bucket{operation="balance_update",le="170"} 1
client_balance_response_duration_histogram_bucket{operation="balance_update",le="210"} 1
client_balance_response_duration_histogram_bucket{operation="balance_update",le="250"} 1
client_balance_response_duration_histogram_bucket{operation="balance_update",le="290"} 1
client_balance_response_duration_histogram_bucket{operation="balance_update",le="330"} 1
client_balance_response_duration_histogram_bucket{operation="balance_update",le="+Inf"} 1
client_balance_response_duration_histogram_sum{operation="balance_update"} 120
client_balance_response_duration_histogram_count{operation="balance_update"} 1
Grafana dashboard
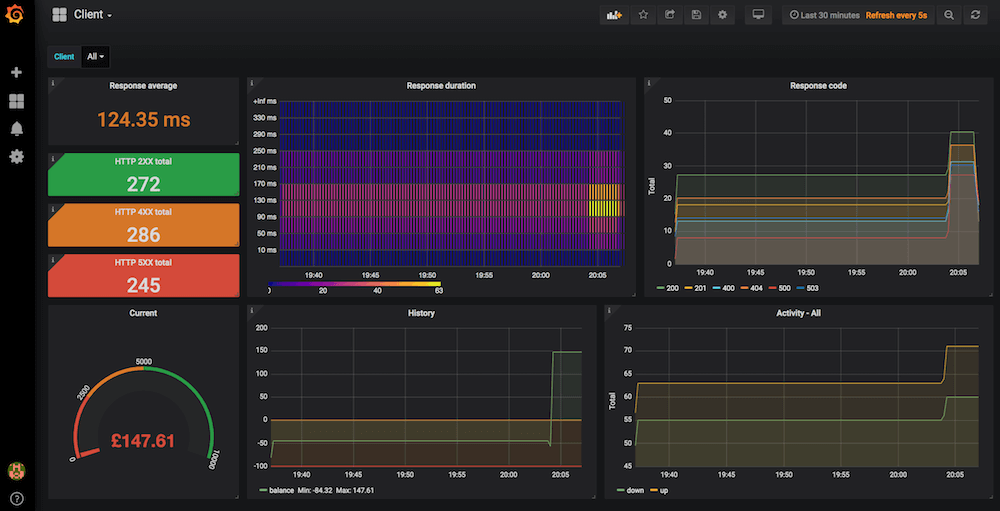
You can import this Json file to create the dashoard above.
{"annotations":{"list":[{"builtIn":1,"datasource":"-- Grafana --","enable":true,"hide":true,"iconColor":"rgba(0, 211, 255, 1)","name":"Annotations & Alerts","type":"dashboard"}]},"editable":true,"gnetId":null,"graphTooltip":0,"id":2,"iteration":1600897537052,"links":[],"panels":[{"cacheTimeout":null,"colorBackground":false,"colorPrefix":false,"colorValue":true,"colors":["#299c46","rgba(237, 129, 40, 0.89)","#d44a3a"],"datasource":"Client","decimals":2,"description":"Overall average response time","format":"none","gauge":{"maxValue":100,"minValue":0,"show":false,"thresholdLabels":false,"thresholdMarkers":true},"gridPos":{"h":3,"w":5,"x":0,"y":0},"id":20,"interval":null,"links":[],"mappingType":1,"mappingTypes":[{"name":"value to text","value":1},{"name":"range to text","value":2}],"maxDataPoints":100,"nullPointMode":"connected","nullText":null,"postfix":"ms","postfixFontSize":"50%","prefix":"","prefixFontSize":"50%","rangeMaps":[{"from":"null","text":"N/A","to":"null"}],"sparkline":{"fillColor":"rgba(31, 118, 189, 0.18)","full":false,"lineColor":"rgb(31, 120, 193)","show":false},"tableColumn":"instance","targets":[{"expr":"rate(client_balance_response_duration_histogram_sum{operation=\"balance_update\"}[30m])\n/\nrate(client_balance_response_duration_histogram_count{operation=\"balance_update\"}[30m])","format":"time_series","instant":false,"intervalFactor":1,"legendFormat":"","refId":"A"}],"thresholds":"100,150,200","title":"Response average","type":"singlestat","valueFontSize":"80%","valueMaps":[{"op":"=","text":"0","value":"null"}],"valueName":"current"},{"cards":{"cardPadding":null,"cardRound":null},"color":{"cardColor":"#b4ff00","colorScale":"sqrt","colorScheme":"interpolatePlasma","exponent":0.5,"max":null,"min":null,"mode":"spectrum"},"dataFormat":"tsbuckets","datasource":"Client","description":"Balance response duration (ms)","gridPos":{"h":9,"w":10,"x":5,"y":0},"heatmap":{},"highlightCards":true,"id":14,"legend":{"show":true},"links":[],"targets":[{"expr":"sum(increase(client_balance_response_duration_histogram_bucket[30m])) by (le)","format":"heatmap","instant":false,"intervalFactor":1,"legendFormat":"{{le}} ms","refId":"A"}],"title":"Response duration","tooltip":{"show":true,"showHistogram":false},"transparent":false,"type":"heatmap","xAxis":{"show":true},"xBucketNumber":null,"xBucketSize":null,"yAxis":{"decimals":null,"format":"short","logBase":1,"max":null,"min":null,"show":true,"splitFactor":null},"yBucketBound":"auto","yBucketNumber":null,"yBucketSize":null},{"aliasColors":{},"bars":false,"dashLength":10,"dashes":false,"datasource":"Client","decimals":0,"description":"Number of HTTP responses - last 30 minutes","fill":1,"gridPos":{"h":9,"w":9,"x":15,"y":0},"id":12,"legend":{"alignAsTable":false,"avg":false,"current":false,"hideEmpty":false,"max":false,"min":false,"rightSide":false,"show":true,"total":false,"values":false},"lines":true,"linewidth":1,"links":[],"nullPointMode":"null","percentage":false,"pointradius":5,"points":false,"renderer":"flot","repeat":null,"seriesOverrides":[],"spaceLength":10,"stack":false,"steppedLine":false,"targets":[{"expr":"sum(increase(client_http_response_counter{operation=\"balance_update\"}[30m])) by (code)","format":"time_series","instant":false,"intervalFactor":1,"legendFormat":"{{code}}","refId":"A"}],"thresholds":[],"timeFrom":null,"timeRegions":[],"timeShift":null,"title":"Response code","tooltip":{"shared":true,"sort":0,"value_type":"individual"},"transparent":false,"type":"graph","xaxis":{"buckets":null,"mode":"time","name":null,"show":true,"values":[]},"yaxes":[{"decimals":null,"format":"short","label":"Total","logBase":1,"max":null,"min":null,"show":true},{"format":"short","label":null,"logBase":1,"max":null,"min":null,"show":true}],"yaxis":{"align":false,"alignLevel":null}},{"cacheTimeout":null,"colorBackground":true,"colorValue":false,"colors":["#299c46","#299c46","#299c46"],"datasource":"Client","description":"Number of HTTP 2XX responses - until now","format":"none","gauge":{"maxValue":100,"minValue":0,"show":false,"thresholdLabels":false,"thresholdMarkers":true},"gridPos":{"h":2,"w":5,"x":0,"y":3},"id":2,"interval":null,"links":[],"mappingType":1,"mappingTypes":[{"name":"value to text","value":1},{"name":"range to text","value":2}],"maxDataPoints":100,"nullPointMode":"connected","nullText":null,"postfix":"","postfixFontSize":"50%","prefix":"","prefixFontSize":"50%","rangeMaps":[{"from":"null","text":"N/A","to":"null"}],"sparkline":{"fillColor":"rgba(31, 118, 189, 0.18)","full":false,"lineColor":"rgb(31, 120, 193)","show":false},"tableColumn":"","targets":[{"expr":"sum(client_http_response_counter{operation=\"balance_update\",code=~\"2.*\"}) OR on() vector(0)","format":"time_series","instant":false,"intervalFactor":1,"legendFormat":"","refId":"A"}],"thresholds":"","title":"HTTP 2XX total","type":"singlestat","valueFontSize":"80%","valueMaps":[{"op":"=","text":"0","value":"null"}],"valueName":"current"},{"cacheTimeout":null,"colorBackground":true,"colorValue":false,"colors":["rgba(237, 129, 40, 0.89)","rgba(237, 129, 40, 0.89)","rgba(237, 129, 40, 0.89)"],"datasource":"Client","description":"Number of HTTP 4XX responses - until now","format":"none","gauge":{"maxValue":100,"minValue":0,"show":false,"thresholdLabels":false,"thresholdMarkers":true},"gridPos":{"h":2,"w":5,"x":0,"y":5},"id":4,"interval":null,"links":[],"mappingType":1,"mappingTypes":[{"name":"value to text","value":1},{"name":"range to text","value":2}],"maxDataPoints":100,"nullPointMode":"connected","nullText":null,"postfix":"","postfixFontSize":"50%","prefix":"","prefixFontSize":"50%","rangeMaps":[{"from":"null","text":"N/A","to":"null"}],"sparkline":{"fillColor":"rgba(31, 118, 189, 0.18)","full":false,"lineColor":"rgb(31, 120, 193)","show":false},"tableColumn":"","targets":[{"expr":"sum(client_http_response_counter{operation=\"balance_update\",code=~\"4.*\"}) OR on() vector(0)","format":"time_series","hide":false,"instant":true,"intervalFactor":1,"legendFormat":"","refId":"A"}],"thresholds":"","title":"HTTP 4XX total","type":"singlestat","valueFontSize":"80%","valueMaps":[{"op":"=","text":"0","value":"null"}],"valueName":"current"},{"cacheTimeout":null,"colorBackground":true,"colorValue":false,"colors":["#d44a3a","#d44a3a","#d44a3a"],"datasource":"Client","decimals":null,"description":"Number of HTTP 5XX responses - until now","format":"none","gauge":{"maxValue":100,"minValue":0,"show":false,"thresholdLabels":false,"thresholdMarkers":true},"gridPos":{"h":2,"w":5,"x":0,"y":7},"id":6,"interval":null,"links":[],"mappingType":1,"mappingTypes":[{"name":"value to text","value":1},{"name":"range to text","value":2}],"maxDataPoints":100,"nullPointMode":"connected","nullText":null,"postfix":"","postfixFontSize":"50%","prefix":"","prefixFontSize":"50%","rangeMaps":[{"from":"null","text":"N/A","to":"null"}],"sparkline":{"fillColor":"rgba(31, 118, 189, 0.18)","full":false,"lineColor":"rgb(31, 120, 193)","show":false},"tableColumn":"","targets":[{"expr":"sum(client_http_response_counter{operation=\"balance_update\",code=~\"5.*\"}) OR on() vector(0)","format":"time_series","hide":false,"instant":true,"intervalFactor":1,"legendFormat":"","refId":"A"}],"thresholds":"","title":"HTTP 5XX total","type":"singlestat","valueFontSize":"80%","valueMaps":[{"op":"=","text":"0","value":"null"}],"valueName":"current"},{"cacheTimeout":null,"colorBackground":false,"colorValue":true,"colors":["#d44a3a","rgba(237, 129, 40, 0.89)","#299c46"],"datasource":"Client","decimals":2,"description":"","format":"currencyGBP","gauge":{"maxValue":10000,"minValue":0,"show":true,"thresholdLabels":true,"thresholdMarkers":true},"gridPos":{"h":8,"w":5,"x":0,"y":9},"id":8,"interval":null,"links":[],"mappingType":1,"mappingTypes":[{"name":"value to text","value":1},{"name":"range to text","value":2}],"maxDataPoints":100,"nullPointMode":"connected","nullText":null,"postfix":"","postfixFontSize":"50%","prefix":"","prefixFontSize":"50%","rangeMaps":[{"from":"null","text":"N/A","to":"null"}],"sparkline":{"fillColor":"rgba(31, 118, 189, 0.18)","full":true,"lineColor":"rgb(31, 120, 193)","show":false},"tableColumn":"","targets":[{"expr":"client_balance_gauge","format":"time_series","instant":true,"intervalFactor":1,"refId":"A"}],"thresholds":"2500,5000,10000","title":"Current","type":"singlestat","valueFontSize":"50%","valueMaps":[{"op":"=","text":"N/A","value":"null"}],"valueName":"current"},{"aliasColors":{},"bars":false,"dashLength":10,"dashes":false,"datasource":"Client","decimals":2,"description":"Changes in balance","fill":1,"gridPos":{"h":8,"w":9,"x":5,"y":9},"hideTimeOverride":false,"id":10,"legend":{"alignAsTable":false,"avg":false,"current":false,"hideEmpty":false,"hideZero":false,"max":true,"min":true,"rightSide":false,"show":true,"total":false,"values":true},"lines":true,"linewidth":1,"links":[],"nullPointMode":"null","percentage":false,"pointradius":5,"points":false,"renderer":"flot","seriesOverrides":[],"spaceLength":10,"stack":false,"steppedLine":false,"targets":[{"expr":"client_balance_gauge","format":"time_series","hide":false,"instant":false,"intervalFactor":1,"legendFormat":"balance","refId":"A"}],"thresholds":[{"colorMode":"warning","fill":true,"line":true,"op":"lt","value":0,"yaxis":"left"},{"colorMode":"critical","fill":true,"line":true,"op":"lt","value":-100,"yaxis":"left"}],"timeFrom":null,"timeRegions":[],"timeShift":null,"title":"History","tooltip":{"shared":true,"sort":0,"value_type":"individual"},"transparent":false,"type":"graph","xaxis":{"buckets":null,"mode":"time","name":null,"show":true,"values":[]},"yaxes":[{"format":"short","label":null,"logBase":1,"max":null,"min":null,"show":true},{"decimals":null,"format":"short","label":"","logBase":1,"max":null,"min":null,"show":true}],"yaxis":{"align":false,"alignLevel":null}},{"aliasColors":{},"bars":false,"dashLength":10,"dashes":false,"datasource":"Client","description":"Balance activity history - until now","fill":1,"gridPos":{"h":8,"w":10,"x":14,"y":9},"id":16,"legend":{"alignAsTable":false,"avg":false,"current":false,"max":false,"min":false,"rightSide":false,"show":true,"total":false,"values":false},"lines":true,"linewidth":1,"links":[],"nullPointMode":"null","percentage":false,"pointradius":5,"points":false,"renderer":"flot","seriesOverrides":[],"spaceLength":10,"stack":false,"steppedLine":false,"targets":[{"expr":"sum(client_balance_activity_counter{client=~\"$client\"}) by (activity)","format":"time_series","hide":false,"instant":false,"intervalFactor":1,"legendFormat":"{{activity}}","refId":"A"}],"thresholds":[],"timeFrom":null,"timeRegions":[],"timeShift":null,"title":"Activity - $client","tooltip":{"shared":true,"sort":0,"value_type":"individual"},"type":"graph","xaxis":{"buckets":null,"mode":"time","name":null,"show":true,"values":[]},"yaxes":[{"decimals":null,"format":"short","label":"Total","logBase":1,"max":null,"min":null,"show":true},{"format":"short","label":"","logBase":1,"max":null,"min":null,"show":true}],"yaxis":{"align":false,"alignLevel":null}}],"refresh":"5s","schemaVersion":16,"style":"dark","tags":[],"templating":{"list":[{"allValue":null,"current":{"tags":[],"text":"All","value":["$__all"]},"datasource":"Client","definition":"label_values(client)","hide":0,"includeAll":true,"label":"Client","multi":true,"name":"client","options":[{"selected":true,"text":"All","value":"$__all"},{"selected":false,"text":"client_1","value":"client_1"},{"selected":false,"text":"client_2","value":"client_2"},{"selected":false,"text":"client_3","value":"client_3"}],"query":"label_values(client)","refresh":0,"regex":"","skipUrlSync":false,"sort":0,"tagValuesQuery":"","tags":[],"tagsQuery":"","type":"query","useTags":false}]},"time":{"from":"now-30m","to":"now"},"timepicker":{"refresh_intervals":["5s","10s","30s","1m","5m","15m","30m","1h","2h","1d"],"time_options":["5m","15m","1h","6h","12h","24h","2d","7d","30d"]},"timezone":"","title":"Client","uid":"QwQN1JdGz","version":25}