Golang'da Prometheus metriklerini kullanma ve Grafana panosu oluşturma
25/09/2020 - DOCKER, GO
Golang uygulama ölçümlerini toplamak için Prometheus'u kullanacağız. Örneğimiz sayaç (counter), gösterge (gauge) ve histogram metrik türlerini içerir. Ölçümleri aldıktan sonra, onları görselleştirmek için bir Grafana panosu oluşturacağız.
Aşağıdaki örnekte, yazıyı olabildiğince kısa tutmak için ölçümleri denetleyicimde manuel olarak toplayacağım. Ancak bu gerçek hayat örneklerinde sürdürülebilir değildir. İdeal çözüm, kod yinelemelerini önlemek amacıyla her ölçüm için bir ara yazılım (middleware) oluşturmaktır.
Bir banka olduğumuzu ve müşterilerin bakiyesiyle ilgili ölçütleri topladığımızı varsayalım. Metrikrimiz şunlardan oluşur::
- HTTP yanıt kodu sayacı. e.g. 200, 400 ...
- Bakiye hareket sayacı. e.g. artış veya azalış.
- Mevcut bakiye.
- Milisaniye cinsinden yanıt süresi.
Önkoşullar
Prometheus paketini yüklemek için go get github.com/prometheus/client_golang/prometheus komutunu çalıştırın.
Yapı
Docker konteynerlerini açtığınızda, Prometheus UI'ye http://localhost:9090/graph adresinden, Graphana UI'ye ise http://localhost:3000/ (admin:admin) adresinden erişebilirsiniz.
├── Makefile
├── build
│   └── dev
│       ├── docker-compose.yaml
│       ├── go
│       │   └── Dockerfile
│       └── prometheus
│           └── prometheus.yml
├── cmd
│   └── client
│       └── main.go
├── go.mod
├── internal
│   ├── controller
│   │   └── balance_update.go
│   └── pkg
│       ├── metric
│       │   ├── counter.go
│       │   ├── gauge.go
│       │   ├── historgam.go
│       │   └── metric.go
│       └── prometheus
│           └── prometheus.go
└── tmp
Dosyalar
Makefile
.PHONY: docker-up
docker-up:
	docker-compose -f build/dev/docker-compose.yaml up --build

.PHONY: docker-down
docker-down:
	docker-compose -f build/dev/docker-compose.yaml down
	docker system prune --volumes --force
build/dev/go/Dockerfile
# STAGE 1: build
FROM golang:1.13.1-alpine3.10 as build

WORKDIR /source

COPY . .

RUN CGO_ENABLED=0 go build -ldflags "-s -w" -o bin/client -v cmd/client/main.go

# STAGE 2: run
FROM alpine:3.10 as run

COPY --from=build /source/bin/client /client

ENTRYPOINT ["/client"]
build/dev/prometheus/prometheus.yml
scrape_configs:
  - job_name: client
    scrape_interval: 15s
    metrics_path: /metrics
    static_configs:
      - targets:
        - go:8080
build/dev/docker-compose.yaml
version: "3.4"

services:

  go:
    build:
      context: "../.."
      dockerfile: "build/dev/go/Dockerfile"
    ports:
      - "8080:8080"

  prometheus:
    image: "prom/prometheus:v2.21.0"
    ports:
      - "9090:9090"
    command:
      - "--config.file=/etc/prometheus/prometheus.yml"
    volumes:
      - "./prometheus/prometheus.yml:/etc/prometheus/prometheus.yml:ro"

  grafana:
    image: "grafana/grafana:5.4.3"
    ports:
      - "3000:3000"
    volumes:
      - "../../tmp/build/grafana:/var/lib/grafana:cached"
cmd/client/main.go
package main

import (
	"log"
	"net/http"

	"github.com/inanzzz/client/internal/controller"
	"github.com/inanzzz/client/internal/pkg/metric"
	"github.com/inanzzz/client/internal/pkg/prometheus"
)

func main() {
	log.Println("server running on :8080")

	// Prometheus
	pro := prometheus.New(true)

	// Metric
	mtr := metric.New(pro.Registry())

	// Router
	rtr := http.NewServeMux()
	rtr.HandleFunc("/metrics", pro.Handler())
	rtr.HandleFunc("/api/v1/balances", controller.NewBalanceUpdate(mtr).Handle)

	// Server
	log.Fatalln(http.ListenAndServe(":8080", rtr))
}
internal/controller/balance_update.go
package controller

import (
	"fmt"
	"math/rand"
	"net/http"
	"strconv"
	"time"

	"github.com/inanzzz/client/internal/pkg/metric"
)

var (
	codes = []int{
		http.StatusOK,
		http.StatusCreated,
		http.StatusBadRequest,
		http.StatusNotFound,
		http.StatusInternalServerError,
		http.StatusServiceUnavailable,
	}
	clients   = []string{"client_1", "client_2", "client_3"}
	amounts   = []string{"5.51", "-2.02", "14.00", "-17.00", "71.17", "-59.01", "9.99", "-19.55", "0.00"}
	durations = []int{32, 43, 55, 67, 76, 88, 99, 101, 106, 109, 111, 120, 131, 135, 148, 160, 180, 203, 210, 211}
)

type BalanceUpdate struct {
	metric metric.Metric
}

func NewBalanceUpdate(metric metric.Metric) BalanceUpdate {
	return BalanceUpdate{
		metric: metric,
	}
}

func (b BalanceUpdate) Handle(w http.ResponseWriter, r *http.Request) {
	rand.Seed(time.Now().UnixNano())

	// Used for histogram.
	start := time.Now()

	// Randomly pick a client.
	client := clients[rand.Intn(len(clients))]

	// Randomly decide how long it would take to respond.
	duration := durations[rand.Intn(len(durations))]

	time.Sleep(time.Duration(duration) * time.Millisecond)

	// Randomly decide what response code we would return.
	code := codes[rand.Intn(len(codes))]

	if code != http.StatusOK {
		b.metric.HTTPResponseCounter.WithLabelValues("balance_update", fmt.Sprintf("%d", code)).Inc()
		dur := float64(time.Since(start).Milliseconds())
		b.metric.ResponseDurationHistogram.WithLabelValues("balance_update").Observe(dur)
		dump(code, dur, "n/a", client)
		return
	}

	// Randomly decide what amount would go in/out of balance.
	amount := amounts[rand.Intn(len(amounts))]

	if amount[0:1] == "-" {
		a, _ := strconv.ParseFloat(amount[1:], 64)
		b.metric.BalanceGauge.Sub(a)
		b.metric.BalanceActivityCounter.WithLabelValues("down", client).Inc()
	} else {
		a, _ := strconv.ParseFloat(amount, 64)
		b.metric.BalanceGauge.Add(a)
		b.metric.BalanceActivityCounter.WithLabelValues("up", client).Inc()
	}

	b.metric.HTTPResponseCounter.WithLabelValues("balance_update", fmt.Sprintf("%d", code)).Inc()
	dur := float64(time.Since(start).Milliseconds())
	b.metric.ResponseDurationHistogram.WithLabelValues("balance_update").Observe(dur)
	dump(code, dur, amount, client)
}

func dump(code int, dur float64, amount string, client string) {
	fmt.Println("CODE:", code, "AMOUNT:", amount, "DURATION:", dur, "CLIENT:", client)
}
internal/pkg/metric/counter.go
Sayaç (counter), değeri yalnızca artabilen tek bir sayısal sayacı temsil eden kümülatif bir metriktir.
package metric

import (
	"github.com/prometheus/client_golang/prometheus"
)

func httpResponseCounter() *prometheus.CounterVec {
	return prometheus.NewCounterVec(prometheus.CounterOpts{
		Namespace: "client",
		Name:      "http_response_counter",
		Help:      "Number of HTTP responses",
	}, []string{"operation", "code"})
}

func balanceActivityCounter() *prometheus.CounterVec {
	return prometheus.NewCounterVec(prometheus.CounterOpts{
		Namespace: "client",
		Name:      "balance_activity_counter",
		Help:      "Balance activity history",
	}, []string{"activity", "client"})
}
internal/pkg/metric/gauge.go
Gösterge (gauge), yukarı ve aşağı gidebilen tek bir sayısal değeri temsil eden bir metriktir. Bu Prometheus'taki en basit metriktir.
package metric

import (
	"github.com/prometheus/client_golang/prometheus"
)

func balanceGauge() prometheus.Gauge {
	return prometheus.NewGauge(prometheus.GaugeOpts{
		Namespace: "client",
		Name:      "balance_gauge",
		Help:      "Current balance",
	})
}
internal/pkg/metric/historgam.go
Histogram, genellikle istek/yanıt süreleri/boyutları gibi bilgileri gözlemler ve paketler halinde sayar. Ayrıca, gözlemlenen tüm değerlerin bir toplamını alır.
package metric

import (
	"github.com/prometheus/client_golang/prometheus"
)

// Here we assume that our balance endpoint usually take between
// 30~220ms and we design our buckets accordingly.
func responseDurationHistogram() *prometheus.HistogramVec {
	return prometheus.NewHistogramVec(prometheus.HistogramOpts{
		Namespace: "client",
		Name:      "balance_response_duration_histogram",
		Help:      "Balance response duration (ms)",
		Buckets:   []float64{10, 50, 90, 130, 170, 210, 250, 290, 330},
		// This is same as prometheus.LinearBuckets(10, 40, 9)
		// 9 buckets starting from 10 increased by 40
	}, []string{"operation"})
}

// Another example:
// 4 buckets starting from 1 multiplied by 3 between. e.g. 1, 3, 9, 27
// prometheus.ExponentialBuckets(1, 3, 9)
internal/pkg/metric/metric.go
package metric

import (
	"github.com/prometheus/client_golang/prometheus"
)

type Metric struct {
	HTTPResponseCounter       *prometheus.CounterVec
	BalanceActivityCounter    *prometheus.CounterVec
	BalanceGauge              prometheus.Gauge
	ResponseDurationHistogram *prometheus.HistogramVec
}

func New(registry *prometheus.Registry) Metric {
	m := &Metric{}

	m.HTTPResponseCounter = httpResponseCounter()
	registry.MustRegister(m.HTTPResponseCounter)
	m.BalanceActivityCounter = balanceActivityCounter()
	registry.MustRegister(m.BalanceActivityCounter)

	m.BalanceGauge = balanceGauge()
	registry.MustRegister(m.BalanceGauge)

	m.ResponseDurationHistogram = responseDurationHistogram()
	registry.MustRegister(m.ResponseDurationHistogram)

	return *m
}
internal/pkg/prometheus/prometheus.go
package prometheus

import (
	"net/http"

	"github.com/prometheus/client_golang/prometheus"
	"github.com/prometheus/client_golang/prometheus/promhttp"
)

type Prometheus struct {
	registry *prometheus.Registry
	handler  http.HandlerFunc
}

// New returns a new `Metric` instance. The `custom` helps keeping or discarding
// all the built-in default metrics. If you just want to see your custom metrics
// set it to `true`.
func New(custom bool) Prometheus {
	reg := prometheus.NewRegistry()

	if custom {
		return Prometheus{
			registry: reg,
			handler: func(w http.ResponseWriter, r *http.Request) {
				promhttp.HandlerFor(reg, promhttp.HandlerOpts{}).ServeHTTP(w, r)
			},
		}

	} else {
		return Prometheus{
			registry: reg,
			handler: func(w http.ResponseWriter, r *http.Request) {
				promhttp.Handler().ServeHTTP(w, r)
			},
		}
	}
}

// Handler returns HTTP handler.
func (p Prometheus) Handler() http.HandlerFunc {
	return p.handler
}

// Registry returns `Registry` instance which helps registering the custom metric collectors.
func (p Prometheus) Registry() *prometheus.Registry {
	return p.registry
}
Test
Aşağıdaki komutu çağırırsanız, sizin için metrikler üretecektir. Metrikleri http://localhost:8080/metrics adresinden görebilirsiniz.
for ((i=1;i<=100;i++)); do curl "http://localhost:8080/api/v1/balances"; done
Elimizde aşağıdakine benzer metrikler oluşacak.
# HELP client_http_response_counter Number of HTTP responses
# TYPE client_http_response_counter counter
client_http_response_counter{code="200",operation="balance_update"} 1
client_http_response_counter{code="400",operation="balance_update"} 1
client_http_response_counter{code="404",operation="balance_update"} 3

# HELP client_balance_activity_counter Balance activity history
# TYPE client_balance_activity_counter counter
client_balance_activity_counter{activity="down",client="client_1"} 1
client_balance_activity_counter{activity="down",client="client_2"} 5
client_balance_activity_counter{activity="down",client="client_3"} 6
client_balance_activity_counter{activity="up",client="client_1"} 9
client_balance_activity_counter{activity="up",client="client_2"} 7
client_balance_activity_counter{activity="up",client="client_3"} 7
# HELP client_balance_gauge Current balance
# TYPE client_balance_gauge gauge
client_balance_gauge -177.59000000000015
Yalnızca bir istek varsa ve yanıt 120 ms sürerse, sonuç aşağıdaki gibi görünecektir.
# HELP client_balance_response_duration_histogram Balance response duration (ms)
# TYPE client_balance_response_duration_histogram histogram
client_balance_response_duration_histogram_bucket{operation="balance_update",le="10"} 0
client_balance_response_duration_histogram_bucket{operation="balance_update",le="50"} 0
client_balance_response_duration_histogram_bucket{operation="balance_update",le="90"} 0
client_balance_response_duration_histogram_bucket{operation="balance_update",le="130"} 1
client_balance_response_duration_histogram_bucket{operation="balance_update",le="170"} 1
client_balance_response_duration_histogram_bucket{operation="balance_update",le="210"} 1
client_balance_response_duration_histogram_bucket{operation="balance_update",le="250"} 1
client_balance_response_duration_histogram_bucket{operation="balance_update",le="290"} 1
client_balance_response_duration_histogram_bucket{operation="balance_update",le="330"} 1
client_balance_response_duration_histogram_bucket{operation="balance_update",le="+Inf"} 1
client_balance_response_duration_histogram_sum{operation="balance_update"} 120
client_balance_response_duration_histogram_count{operation="balance_update"} 1
Grafana paneli
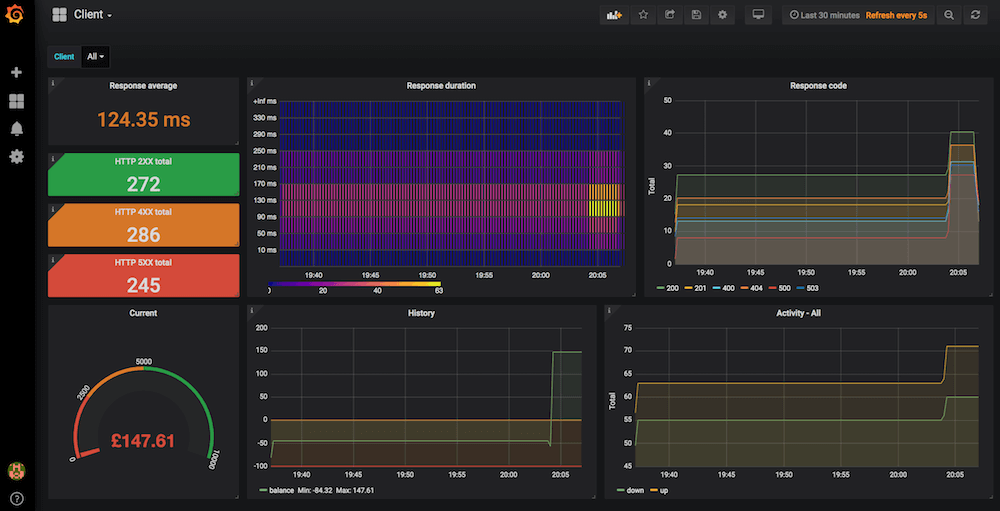
Yukarıdaki paneli oluşturmak için bu Json dosyasını yükleyebilirsiniz.
{"annotations":{"list":[{"builtIn":1,"datasource":"-- Grafana --","enable":true,"hide":true,"iconColor":"rgba(0, 211, 255, 1)","name":"Annotations & Alerts","type":"dashboard"}]},"editable":true,"gnetId":null,"graphTooltip":0,"id":2,"iteration":1600897537052,"links":[],"panels":[{"cacheTimeout":null,"colorBackground":false,"colorPrefix":false,"colorValue":true,"colors":["#299c46","rgba(237, 129, 40, 0.89)","#d44a3a"],"datasource":"Client","decimals":2,"description":"Overall average response time","format":"none","gauge":{"maxValue":100,"minValue":0,"show":false,"thresholdLabels":false,"thresholdMarkers":true},"gridPos":{"h":3,"w":5,"x":0,"y":0},"id":20,"interval":null,"links":[],"mappingType":1,"mappingTypes":[{"name":"value to text","value":1},{"name":"range to text","value":2}],"maxDataPoints":100,"nullPointMode":"connected","nullText":null,"postfix":"ms","postfixFontSize":"50%","prefix":"","prefixFontSize":"50%","rangeMaps":[{"from":"null","text":"N/A","to":"null"}],"sparkline":{"fillColor":"rgba(31, 118, 189, 0.18)","full":false,"lineColor":"rgb(31, 120, 193)","show":false},"tableColumn":"instance","targets":[{"expr":"rate(client_balance_response_duration_histogram_sum{operation=\"balance_update\"}[30m])\n/\nrate(client_balance_response_duration_histogram_count{operation=\"balance_update\"}[30m])","format":"time_series","instant":false,"intervalFactor":1,"legendFormat":"","refId":"A"}],"thresholds":"100,150,200","title":"Response average","type":"singlestat","valueFontSize":"80%","valueMaps":[{"op":"=","text":"0","value":"null"}],"valueName":"current"},{"cards":{"cardPadding":null,"cardRound":null},"color":{"cardColor":"#b4ff00","colorScale":"sqrt","colorScheme":"interpolatePlasma","exponent":0.5,"max":null,"min":null,"mode":"spectrum"},"dataFormat":"tsbuckets","datasource":"Client","description":"Balance response duration (ms)","gridPos":{"h":9,"w":10,"x":5,"y":0},"heatmap":{},"highlightCards":true,"id":14,"legend":{"show":true},"links":[],"targets":[{"expr":"sum(increase(client_balance_response_duration_histogram_bucket[30m])) by (le)","format":"heatmap","instant":false,"intervalFactor":1,"legendFormat":"{{le}} ms","refId":"A"}],"title":"Response duration","tooltip":{"show":true,"showHistogram":false},"transparent":false,"type":"heatmap","xAxis":{"show":true},"xBucketNumber":null,"xBucketSize":null,"yAxis":{"decimals":null,"format":"short","logBase":1,"max":null,"min":null,"show":true,"splitFactor":null},"yBucketBound":"auto","yBucketNumber":null,"yBucketSize":null},{"aliasColors":{},"bars":false,"dashLength":10,"dashes":false,"datasource":"Client","decimals":0,"description":"Number of HTTP responses - last 30 minutes","fill":1,"gridPos":{"h":9,"w":9,"x":15,"y":0},"id":12,"legend":{"alignAsTable":false,"avg":false,"current":false,"hideEmpty":false,"max":false,"min":false,"rightSide":false,"show":true,"total":false,"values":false},"lines":true,"linewidth":1,"links":[],"nullPointMode":"null","percentage":false,"pointradius":5,"points":false,"renderer":"flot","repeat":null,"seriesOverrides":[],"spaceLength":10,"stack":false,"steppedLine":false,"targets":[{"expr":"sum(increase(client_http_response_counter{operation=\"balance_update\"}[30m])) by (code)","format":"time_series","instant":false,"intervalFactor":1,"legendFormat":"{{code}}","refId":"A"}],"thresholds":[],"timeFrom":null,"timeRegions":[],"timeShift":null,"title":"Response code","tooltip":{"shared":true,"sort":0,"value_type":"individual"},"transparent":false,"type":"graph","xaxis":{"buckets":null,"mode":"time","name":null,"show":true,"values":[]},"yaxes":[{"decimals":null,"format":"short","label":"Total","logBase":1,"max":null,"min":null,"show":true},{"format":"short","label":null,"logBase":1,"max":null,"min":null,"show":true}],"yaxis":{"align":false,"alignLevel":null}},{"cacheTimeout":null,"colorBackground":true,"colorValue":false,"colors":["#299c46","#299c46","#299c46"],"datasource":"Client","description":"Number of HTTP 2XX responses - until now","format":"none","gauge":{"maxValue":100,"minValue":0,"show":false,"thresholdLabels":false,"thresholdMarkers":true},"gridPos":{"h":2,"w":5,"x":0,"y":3},"id":2,"interval":null,"links":[],"mappingType":1,"mappingTypes":[{"name":"value to text","value":1},{"name":"range to text","value":2}],"maxDataPoints":100,"nullPointMode":"connected","nullText":null,"postfix":"","postfixFontSize":"50%","prefix":"","prefixFontSize":"50%","rangeMaps":[{"from":"null","text":"N/A","to":"null"}],"sparkline":{"fillColor":"rgba(31, 118, 189, 0.18)","full":false,"lineColor":"rgb(31, 120, 193)","show":false},"tableColumn":"","targets":[{"expr":"sum(client_http_response_counter{operation=\"balance_update\",code=~\"2.*\"}) OR on() vector(0)","format":"time_series","instant":false,"intervalFactor":1,"legendFormat":"","refId":"A"}],"thresholds":"","title":"HTTP 2XX total","type":"singlestat","valueFontSize":"80%","valueMaps":[{"op":"=","text":"0","value":"null"}],"valueName":"current"},{"cacheTimeout":null,"colorBackground":true,"colorValue":false,"colors":["rgba(237, 129, 40, 0.89)","rgba(237, 129, 40, 0.89)","rgba(237, 129, 40, 0.89)"],"datasource":"Client","description":"Number of HTTP 4XX responses - until now","format":"none","gauge":{"maxValue":100,"minValue":0,"show":false,"thresholdLabels":false,"thresholdMarkers":true},"gridPos":{"h":2,"w":5,"x":0,"y":5},"id":4,"interval":null,"links":[],"mappingType":1,"mappingTypes":[{"name":"value to text","value":1},{"name":"range to text","value":2}],"maxDataPoints":100,"nullPointMode":"connected","nullText":null,"postfix":"","postfixFontSize":"50%","prefix":"","prefixFontSize":"50%","rangeMaps":[{"from":"null","text":"N/A","to":"null"}],"sparkline":{"fillColor":"rgba(31, 118, 189, 0.18)","full":false,"lineColor":"rgb(31, 120, 193)","show":false},"tableColumn":"","targets":[{"expr":"sum(client_http_response_counter{operation=\"balance_update\",code=~\"4.*\"}) OR on() vector(0)","format":"time_series","hide":false,"instant":true,"intervalFactor":1,"legendFormat":"","refId":"A"}],"thresholds":"","title":"HTTP 4XX total","type":"singlestat","valueFontSize":"80%","valueMaps":[{"op":"=","text":"0","value":"null"}],"valueName":"current"},{"cacheTimeout":null,"colorBackground":true,"colorValue":false,"colors":["#d44a3a","#d44a3a","#d44a3a"],"datasource":"Client","decimals":null,"description":"Number of HTTP 5XX responses - until now","format":"none","gauge":{"maxValue":100,"minValue":0,"show":false,"thresholdLabels":false,"thresholdMarkers":true},"gridPos":{"h":2,"w":5,"x":0,"y":7},"id":6,"interval":null,"links":[],"mappingType":1,"mappingTypes":[{"name":"value to text","value":1},{"name":"range to text","value":2}],"maxDataPoints":100,"nullPointMode":"connected","nullText":null,"postfix":"","postfixFontSize":"50%","prefix":"","prefixFontSize":"50%","rangeMaps":[{"from":"null","text":"N/A","to":"null"}],"sparkline":{"fillColor":"rgba(31, 118, 189, 0.18)","full":false,"lineColor":"rgb(31, 120, 193)","show":false},"tableColumn":"","targets":[{"expr":"sum(client_http_response_counter{operation=\"balance_update\",code=~\"5.*\"}) OR on() vector(0)","format":"time_series","hide":false,"instant":true,"intervalFactor":1,"legendFormat":"","refId":"A"}],"thresholds":"","title":"HTTP 5XX total","type":"singlestat","valueFontSize":"80%","valueMaps":[{"op":"=","text":"0","value":"null"}],"valueName":"current"},{"cacheTimeout":null,"colorBackground":false,"colorValue":true,"colors":["#d44a3a","rgba(237, 129, 40, 0.89)","#299c46"],"datasource":"Client","decimals":2,"description":"","format":"currencyGBP","gauge":{"maxValue":10000,"minValue":0,"show":true,"thresholdLabels":true,"thresholdMarkers":true},"gridPos":{"h":8,"w":5,"x":0,"y":9},"id":8,"interval":null,"links":[],"mappingType":1,"mappingTypes":[{"name":"value to text","value":1},{"name":"range to text","value":2}],"maxDataPoints":100,"nullPointMode":"connected","nullText":null,"postfix":"","postfixFontSize":"50%","prefix":"","prefixFontSize":"50%","rangeMaps":[{"from":"null","text":"N/A","to":"null"}],"sparkline":{"fillColor":"rgba(31, 118, 189, 0.18)","full":true,"lineColor":"rgb(31, 120, 193)","show":false},"tableColumn":"","targets":[{"expr":"client_balance_gauge","format":"time_series","instant":true,"intervalFactor":1,"refId":"A"}],"thresholds":"2500,5000,10000","title":"Current","type":"singlestat","valueFontSize":"50%","valueMaps":[{"op":"=","text":"N/A","value":"null"}],"valueName":"current"},{"aliasColors":{},"bars":false,"dashLength":10,"dashes":false,"datasource":"Client","decimals":2,"description":"Changes in balance","fill":1,"gridPos":{"h":8,"w":9,"x":5,"y":9},"hideTimeOverride":false,"id":10,"legend":{"alignAsTable":false,"avg":false,"current":false,"hideEmpty":false,"hideZero":false,"max":true,"min":true,"rightSide":false,"show":true,"total":false,"values":true},"lines":true,"linewidth":1,"links":[],"nullPointMode":"null","percentage":false,"pointradius":5,"points":false,"renderer":"flot","seriesOverrides":[],"spaceLength":10,"stack":false,"steppedLine":false,"targets":[{"expr":"client_balance_gauge","format":"time_series","hide":false,"instant":false,"intervalFactor":1,"legendFormat":"balance","refId":"A"}],"thresholds":[{"colorMode":"warning","fill":true,"line":true,"op":"lt","value":0,"yaxis":"left"},{"colorMode":"critical","fill":true,"line":true,"op":"lt","value":-100,"yaxis":"left"}],"timeFrom":null,"timeRegions":[],"timeShift":null,"title":"History","tooltip":{"shared":true,"sort":0,"value_type":"individual"},"transparent":false,"type":"graph","xaxis":{"buckets":null,"mode":"time","name":null,"show":true,"values":[]},"yaxes":[{"format":"short","label":null,"logBase":1,"max":null,"min":null,"show":true},{"decimals":null,"format":"short","label":"","logBase":1,"max":null,"min":null,"show":true}],"yaxis":{"align":false,"alignLevel":null}},{"aliasColors":{},"bars":false,"dashLength":10,"dashes":false,"datasource":"Client","description":"Balance activity history - until now","fill":1,"gridPos":{"h":8,"w":10,"x":14,"y":9},"id":16,"legend":{"alignAsTable":false,"avg":false,"current":false,"max":false,"min":false,"rightSide":false,"show":true,"total":false,"values":false},"lines":true,"linewidth":1,"links":[],"nullPointMode":"null","percentage":false,"pointradius":5,"points":false,"renderer":"flot","seriesOverrides":[],"spaceLength":10,"stack":false,"steppedLine":false,"targets":[{"expr":"sum(client_balance_activity_counter{client=~\"$client\"}) by (activity)","format":"time_series","hide":false,"instant":false,"intervalFactor":1,"legendFormat":"{{activity}}","refId":"A"}],"thresholds":[],"timeFrom":null,"timeRegions":[],"timeShift":null,"title":"Activity - $client","tooltip":{"shared":true,"sort":0,"value_type":"individual"},"type":"graph","xaxis":{"buckets":null,"mode":"time","name":null,"show":true,"values":[]},"yaxes":[{"decimals":null,"format":"short","label":"Total","logBase":1,"max":null,"min":null,"show":true},{"format":"short","label":"","logBase":1,"max":null,"min":null,"show":true}],"yaxis":{"align":false,"alignLevel":null}}],"refresh":"5s","schemaVersion":16,"style":"dark","tags":[],"templating":{"list":[{"allValue":null,"current":{"tags":[],"text":"All","value":["$__all"]},"datasource":"Client","definition":"label_values(client)","hide":0,"includeAll":true,"label":"Client","multi":true,"name":"client","options":[{"selected":true,"text":"All","value":"$__all"},{"selected":false,"text":"client_1","value":"client_1"},{"selected":false,"text":"client_2","value":"client_2"},{"selected":false,"text":"client_3","value":"client_3"}],"query":"label_values(client)","refresh":0,"regex":"","skipUrlSync":false,"sort":0,"tagValuesQuery":"","tags":[],"tagsQuery":"","type":"query","useTags":false}]},"time":{"from":"now-30m","to":"now"},"timepicker":{"refresh_intervals":["5s","10s","30s","1m","5m","15m","30m","1h","2h","1d"],"time_options":["5m","15m","1h","6h","12h","24h","2d","7d","30d"]},"timezone":"","title":"Client","uid":"QwQN1JdGz","version":25}