Ubuntu 14.04 içinde Elasticsearch, Logstash ve Kibana (ELK kümesi) kurmak
29/06/2017 - ELASTICSEARCH, LINUX
Bu örneğimizde Ubuntu 14.04 içinde Elasticsearch, Logstash ve Kibana (ELK kümesi) kuracağız. Test amacıyla Logstash'ı Apache ulaşım kayıtlarını kaydetmesi için ayarlayacağız. İsterseniz website, syslog vs. gibi birden fazla log dosyasını kaydetmek için kullanabilirsiniz.
Mantık
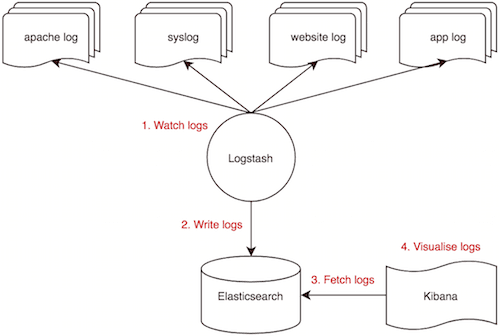
Sistemin çalışma prensibi aşağıdaki gibidir.
Sistemimiz
ELK kümemiz aşağıdaki üç parçadan oluşuyor.
- Logstash: Dışarıdan gelen log mesajlarını alır. Versiyon 2.3.4
- Elasticsearch: Log mesajlarını kaydeder. Versiyon 2.4.5
- Kibana: Log mesajlarını arama ve görsel hale dönüştürmek için kullanılan web arayüzü. Versiyon 4.5.4
Ek olarak iki tane daha parçamız var. Sunucu IP adresimiz 192.168.50.40.
- Apache2 versiyon 2.4.7
- Java 8 versiyon 1.8.0_131
İşletim sistemimiz
Kütüphaneyi yenileme.
$ sudo apt-get -y update
Apache
Kurulum.
$ sudo apt-get install -y apache2
Konfigürasyon.
$ sudo nano /etc/apache2/apache2.conf
ServerName localhost
Yeniden başlatma.
$ sudo service apache2 restart
Java
Kütüphane ekini ekleme.
$ sudo add-apt-repository -y ppa:webupd8team/java
Kütüphaneyi yenileme.
$ sudo apt-get -y update
Kurulum.
$ sudo apt-get -y install oracle-java8-installer
Elasticsearch
Public key eklemesi.
$ wget -qO - https://packages.elastic.co/GPG-KEY-elasticsearch | sudo apt-key add -
Kaynak listesini yaratma.
$ echo "deb http://packages.elastic.co/elasticsearch/2.x/debian stable main" | sudo tee -a /etc/apt/sources.list.d/elasticsearch-2.x.list
Kütüphaneyi yenileme.
$ sudo apt-get -y update
Kurulum.
$ sudo apt-get -y install elasticsearch
Konfigürasyon.
$ sudo nano /etc/elasticsearch/elasticsearch.yml
cluster.name: elk-cluster
node.name: elk-node
bootstrap.memory_lock: true
network.host: localhost
http.port: 9200
Başlatma.
$ sudo service elasticsearch start
Test.
$ curl localhost:9200
{
  "name" : "elk-node",
  "cluster_name" : "elk-cluster",
  "cluster_uuid" : "Ocu_bS3jQ_G8rpAHVuRgBw",
  "version" : {
    "number" : "2.4.5",
    "build_hash" : "c849dd13904f53e63e88efc33b2ceeda0b6a1276",
    "build_timestamp" : "2017-04-24T16:18:17Z",
    "build_snapshot" : false,
    "lucene_version" : "5.5.4"
  },
  "tagline" : "You Know, for Search"
}
Mevcut index kontrolü. Gördüğümüz gibi daha indeximiz yok.
$ curl localhost:9200/_cat/indices
Dinlenen IP ve port kontrolü.
$ netstat -pltn
Proto Recv-Q Send-Q Local Address           Foreign Address         State       PID/Program name
tcp6       0      0 127.0.0.1:9200          :::*                    LISTEN      -
Kibana
Kaynak listesini yaratma.
$ echo "deb http://packages.elastic.co/kibana/4.5/debian stable main" | sudo tee -a /etc/apt/sources.list
Kütüphaneyi yenileme.
$ sudo apt-get -y update
Kurulum.
$ sudo apt-get -y install kibana
Konfigürasyon.
$ sudo nano /opt/kibana/config/kibana.yml
server.port: 5601
server.host: "0.0.0.0"
Başlatma.
$ sudo service kibana start
Dinlenen IP ve port kontrolü.
$ netstat -pltn
Proto Recv-Q Send-Q Local Address           Foreign Address         State       PID/Program name
tcp        0      0 0.0.0.0:5601            0.0.0.0:*               LISTEN      -
Mevcut index kontrolü. Gördüğümüz gibi varsayılan "kibana" indeximiz yaratıldı.
$ curl localhost:9200/_cat/indices
yellow open .kibana 1 1 1 0 3kb 3kb
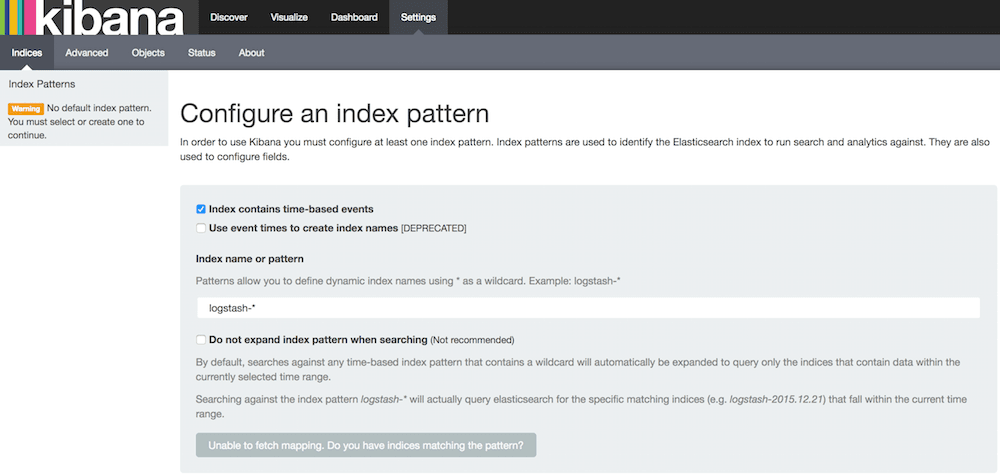
Tarayıcıdan http://192.168.50.40:5601 adresine giderek web arayüzüne ulaşabilirsiniz. İçinde bulunduğumuz anda herhangi bir index modeli bulunmayacak.
Logstash
Kaynak listesini yaratma.
$ echo "deb http://packages.elastic.co/logstash/2.3/debian stable main" | sudo tee -a /etc/apt/sources.list
Kütüphaneyi yenileme.
$ sudo apt-get -y update
Kurulum.
$ sudo apt-get -y install logstash
Test amacıyla aşağıdaki konfigürasyon log mesajlarını elasticsearch yerine terminale yazacak. Önemli: Eğer start_position bilgisini okumazsanız ve de sincedb_path ekini kullanmazsanız, Logstash'ı her yeniden başlatma işleminden sonra, daha önceden okunmuş olan kayıtları tekrardan okuma gibi bir tehlikeyle karşı karşıya kalabilirsiniz ki bu da bir facia olabilir!
$ sudo nano /etc/logstash/conf.d/apache-access.conf
input {
    file {
        path => "/var/log/apache2/access.log"
        start_position => "beginning"
    }
}

filter {
    grok {
        match => { "message" => "%{COMBINEDAPACHELOG}" }
    }
}

output {
    stdout { codec => rubydebug }
}
Apache loglarının grok regexi COMBINEDAPACHELOG aşağıdaki gibidir. Detaylı bilgi için grok-patterns sayfasına bakabilirsiniz.
COMMONAPACHELOG %{IPORHOST:clientip} %{USER:ident} %{USER:auth} \[%{HTTPDATE:timestamp}\] "(?:%{WORD:verb} %{NOTSPACE:request}(?: HTTP/%{NUMBER:httpversion})?|%{DATA:rawrequest})" %{NUMBER:response} (?:%{NUMBER:bytes}|-)
COMBINEDAPACHELOG %{COMMONAPACHELOG} %{QS:referrer} %{QS:agent}
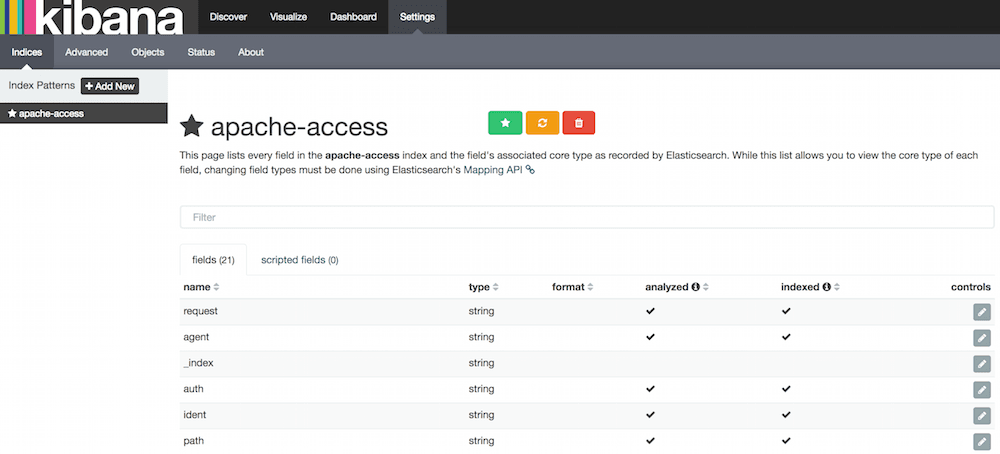
Yukarıda gördüğümüz gibi aşağıdaki alanlar elasticsearch indexi içinde yaratılıyor ve de siz bunları Kibana içinde grafik yaratmak için kullanabilirsiniz.
clientip
ident
auth
timestamp
verb
request
httpversion
rawrequest
response
bytes
referrer
agent
Konfigürasyon dosyasını doğrulama 10 saniye alır.
$ sudo /opt/logstash/bin/logstash --configtest -f /etc/logstash/conf.d/
Configuration OK
Tarayıcınızdan http://192.168.50.40/ adresine gitmeden önce, terminalden aşağıdaki komutu çalıştırarak konfigürasyon dosyasını test edin ve "Logstash startup completed" mesajını bekleyin.
$ sudo /opt/logstash/bin/logstash -f /etc/logstash/conf.d
Settings: Default pipeline workers: 2
Pipeline main started
{
        "message" => "192.168.50.1 - - [28/Jun/2017:22:08:31 +0000] \"GET / HTTP/1.1\" 200 3594 \"-\" \"Mozilla/5.0 (Macintosh; Intel Mac OS X 10.10; rv:53.0) Gecko/20100101 Firefox/53.0\"",
       "@version" => "1",
     "@timestamp" => "2017-06-28T22:08:32.192Z",
           "path" => "/var/log/apache2/access.log",
           "host" => "elk",
       "clientip" => "192.168.50.1",
          "ident" => "-",
           "auth" => "-",
      "timestamp" => "28/Jun/2017:22:08:31 +0000",
           "verb" => "GET",
        "request" => "/",
    "httpversion" => "1.1",
       "response" => "200",
          "bytes" => "3594",
       "referrer" => "\"-\"",
          "agent" => "\"Mozilla/5.0 (Macintosh; Intel Mac OS X 10.10; rv:53.0) Gecko/20100101 Firefox/53.0\""
}
Yukarıdaki komuttan "ctrl+c" ile çıkmak Logstash'ın durmasına neden olur o nedenle yeniden başlatalım.
$ sudo service logstash start
Mevcut index kontrolü. Aşağıda gördüğümüz gibi sadece "kibana" indeximiz var.
$ curl localhost:9200/_cat/indices
yellow open .kibana 1 1 1 0 3kb 3kb
Konfigürasyon dosyasını yenileyerek logların Elasticsearch indexine kaydedilmesini sağlayalım.
$ sudo nano /etc/logstash/conf.d/apache-access.conf
...
output {
    elasticsearch {
        hosts => ["localhost:9200"]
        sniffing => true
        manage_template => false
        index => "apache-access"
        # document_type => "apache_logs" # This is unnecessary
    }
}
...
Konfigürasyon dosyasını doğrulama 10 saniye alır.
$ sudo /opt/logstash/bin/logstash --configtest -f /etc/logstash/conf.d/
Configuration OK
Yeniden başlatma.
$ sudo service logstash stop
$ sudo service logstash start
Mevcut index kontrolü. Aşağıda gördüğümüz gibi sadece "kibana" indeximiz var çünkü daha Apache'ye istek göndermedik.
$ curl localhost:9200/_cat/indices
yellow open .kibana 1 1 1 0 3kb 3kb
Tarayıcınızdan http://192.168.50.40 adresine gidin ve mevcut indexleri tekrar kontrol edin. Aşağıda da gördüğümüz gibi Apache'ye istek gönderir göndermez "apache-access" indeximiz yaratıldı.
$ curl localhost:9200/_cat/indices
yellow open .kibana       1 1 1 0 3.1kb 3.1kb
yellow open apache-access 5 1 2 0   7kb   7kb
Kibana GUI
Kurulum
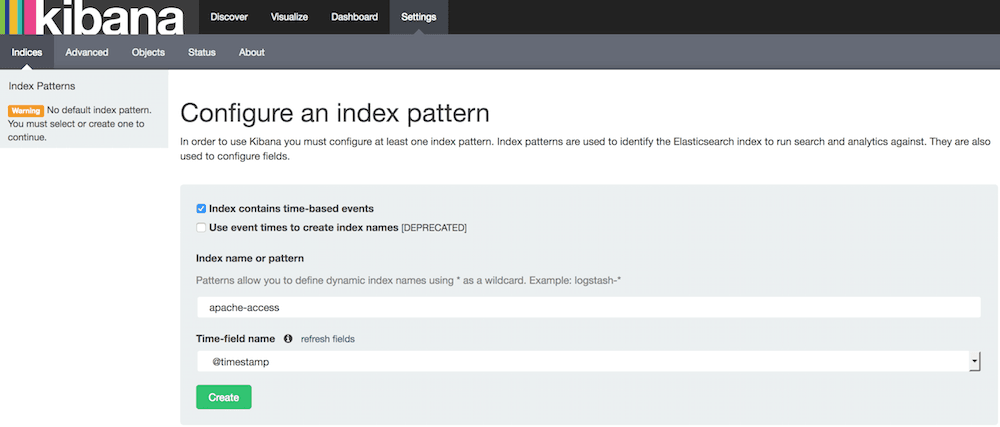
- Web arayüzüne ulaşmak için
http://192.168.50.40:5601adresine gidin. - "Index name or pattern" alanına "apache-access" yazın.
- "Create" butonun görünmesini bekleyin ve sonra basın.
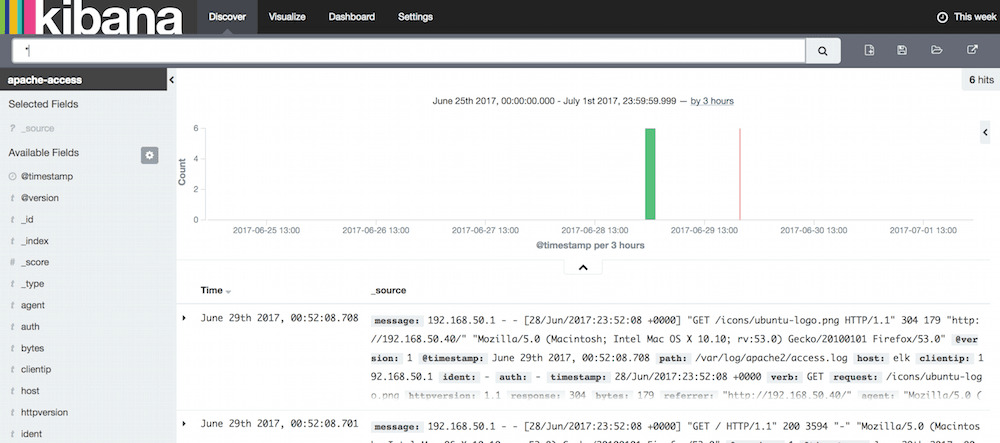
Loglar
Üstteki menüden "Discover" seçeneğini seçin. Menü çubuğunun en sağındaki "This week" seçeneğini seçerek logları görebilirsiniz.
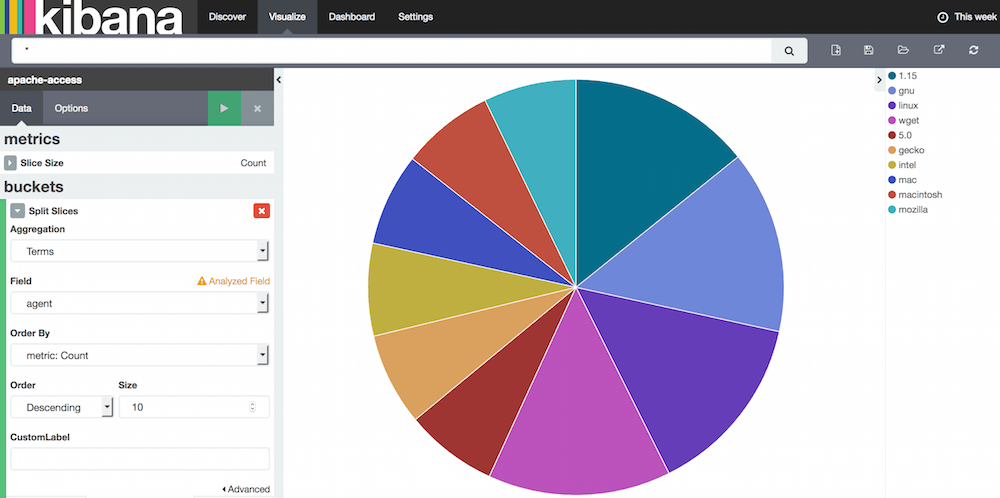
Yuvarlak diyagram
Bu diyagramı yaratmadan önce Apache'ye teminalden veya tarayıcıdan istekler gönderin ki gösterecek log olsun.
- Üstteki "Visualize" menü seçeneğini seçin.
- "Pie chart" seçeneğini seçin.
- "From a new search" seçeneğini seçin.
- Soldan "Split Slices" seçeneğini seçin.
- "Aggregation" alanı için "Terms" seçeneğini seçin.
- "Field" alanı için "agent" seçeneğini seçin.
- "Size" alanını "10" olarak ayarlayın.
- Üstteki yeşil oynatma butonuna basın.
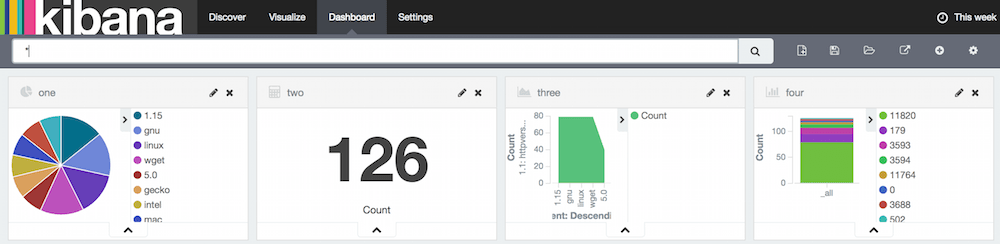
Gösterge paneli
Favori diyagramların gösterildiği yerdir. Gösterge panelinde göstermek için öncelikle örnek diyagramlar yaratıp kaydetmeniz gerekir. Bu panelin iyi yanı, gerçek zamanlı yenilemelerin otomatik olarak yansıtılmasıdır.
Elasticsearch içeriği
İçerik
$ curl -XGET localhost:9200/apache-access/_search?pretty=1
{
  "took": 11,
  "timed_out": false,
  "_shards": {
    "total": 5,
    "successful": 5,
    "failed": 0
  },
  "hits": {
    "total": 2,
    "max_score": 1.0,
    "hits": [
      {
        "_index": "apache-access",
        "_type": "apache_logs",
        "_id": "AVzw9egNH2fJ_S5AJbbc",
        "_score": 1.0,
        "_source": {
          "message": "192.168.50.1 - - [28/Jun/2017:23:07:44 +0000] \"GET / HTTP/1.1\" 200 3594 \"-\" \"Mozilla/5.0 ....",
          "@version": "1",
          "@timestamp": "2017-06-28T23:07:45.269Z",
          "path": "/var/log/apache2/access.log",
          "host": "elk",
          "clientip": "192.168.50.1",
          "ident": "-",
          "auth": "-",
          "timestamp": "28/Jun/2017:23:07:44 +0000",
          "verb": "GET",
          "request": "/",
          "httpversion": "1.1",
          "response": "200",
          "bytes": "3594",
          "referrer": "\"-\"",
          "agent": "\"Mozilla/5.0 (Macintosh; Intel Mac OS X 10.10; rv:53.0) Gecko/20100101 Firefox/53.0\""
        }
      },
      {
        "_index": "apache-access",
        "_type": "apache_logs",
        "_id": "AVzw9egNH2fJ_S5AJbbd",
        "_score": 1.0,
        "_source": {
          "message": "192.168.50.1 - - [28/Jun/2017:23:07:44 +0000] \"GET /icons/ubuntu-logo.png HTTP/1.1\" 304 ....",
          "@version": "1",
          "@timestamp": "2017-06-28T23:07:45.299Z",
          "path": "/var/log/apache2/access.log",
          "host": "elk",
          "clientip": "192.168.50.1",
          "ident": "-",
          "auth": "-",
          "timestamp": "28/Jun/2017:23:07:44 +0000",
          "verb": "GET",
          "request": "/icons/ubuntu-logo.png",
          "httpversion": "1.1",
          "response": "304",
          "bytes": "179",
          "referrer": "\"http://192.168.50.40/\"",
          "agent": "\"Mozilla/5.0 (Macintosh; Intel Mac OS X 10.10; rv:53.0) Gecko/20100101 Firefox/53.0\""
        }
      }
    ]
  }
}
Haritalama
$ curl -X GET localhost:9200/_mapping/apache_logs?pretty
{
  "apache-access" : {
    "mappings" : {
      "apache_logs" : {
        "properties" : {
          "@timestamp" : {
            "type" : "date",
            "format" : "strict_date_optional_time||epoch_millis"
          },
          "@version" : {
            "type" : "string"
          },
          "agent" : {
            "type" : "string"
          },
          "auth" : {
            "type" : "string"
          },
          "bytes" : {
            "type" : "string"
          },
          "clientip" : {
            "type" : "string"
          },
          "host" : {
            "type" : "string"
          },
          "httpversion" : {
            "type" : "string"
          },
          "ident" : {
            "type" : "string"
          },
          "message" : {
            "type" : "string"
          },
          "path" : {
            "type" : "string"
          },
          "referrer" : {
            "type" : "string"
          },
          "request" : {
            "type" : "string"
          },
          "response" : {
            "type" : "string"
          },
          "timestamp" : {
            "type" : "string"
          },
          "verb" : {
            "type" : "string"
          }
        }
      }
    }
  }
}