SSL kullanmadan Ubuntu 14.04 içinde Elasticsearch, Logstash, Kibana (ELK kümesi) ve Filebeat kurmak
01/07/2017 - ELASTICSEARCH, LINUX
Bu örneğimizde SSL kullanmadan Ubuntu 14.04 içinde Elasticsearch, Logstash, Kibana (ELK kümesi) ve Filebeat kuracağız. Test olarak Filebeat, Apache ulaşım kayıtlarını WEB sunucusu üzerinden ELK sunucusundaki Logstash'a iletecek. İsterseniz website, syslog vs. gibi birden fazla log dosyasını kaydetmek için kullanabilirsiniz.
Mantık
Sistemin çalışma prensibi aşağıdaki gibidir.

ELK sunucusu
ELK kümemiz aşağıdaki üç parçadan oluşuyor.
- Logstash: Dışarıdan gelen log mesajlarını alır. Versiyon 2.3.4
- Elasticsearch: Log mesajlarını kaydeder. Versiyon 2.4.5
- Kibana: Log mesajlarını arama ve görsel hale dönüştürmek için kullanılan web arayüzü. Versiyon 4.5.4
Ek olarak bir tane daha parçamız var. Sunucu IP adresimiz 192.168.50.40.
- Java 8 versiyon 1.8.0_131
WEB sunucusu
WEB aşağıdaki tek parçadan oluşuyor.
- Filebeat: Client sunucudaki logları takip edip, ELK sunucularına iletmek için kullanılır. Versiyon 5.4.0
Ek olarak iki tane daha parçamız var. Sunucu IP adresimiz 192.168.50.50.
- Apache2 versiyon 2.4.7
- Java 8 versiyon 1.8.0_131
Herhangi bir nedenden dolayı sunucunun durup yeniden başlaması gibi durumlarda, Filebeat daha önceden nerede kaldığını hatırlama yeteneğine sahiptir. Logları hem Elasticsearch, hem de Logstash'a gönderebilir.
ELK sunucusu
İşletim sistemi
Kütüphaneyi yenileme.
$ sudo apt-get -y update
Java
Kütüphane ekini ekleme.
$ sudo add-apt-repository -y ppa:webupd8team/java
Kütüphaneyi yenileme.
$ sudo apt-get -y update
Kurulum.
$ sudo apt-get -y install oracle-java8-installer
Elasticsearch
Public key eklemesi.
$ wget -qO - https://packages.elastic.co/GPG-KEY-elasticsearch | sudo apt-key add -
Creating source list.
$ echo "deb http://packages.elastic.co/elasticsearch/2.x/debian stable main" | sudo tee -a /etc/apt/sources.list.d/elasticsearch-2.x.list
Kaynak listesini yaratma.
$ sudo apt-get -y update
Kurulum.
$ sudo apt-get -y install elasticsearch
Konfigürasyon.
$ sudo nano /etc/elasticsearch/elasticsearch.yml
cluster.name: elk-cluster
node.name: elk-node
bootstrap.memory_lock: true
network.host: localhost
http.port: 9200
Başlatma.
$ sudo service elasticsearch start
Test.
$ curl localhost:9200
{
  "name" : "elk-node",
  "cluster_name" : "elk-cluster",
  "cluster_uuid" : "Ocu_bS3jQ_G8rpAHVuRgBw",
  "version" : {
    "number" : "2.4.5",
    "build_hash" : "c849dd13904f53e63e88efc33b2ceeda0b6a1276",
    "build_timestamp" : "2017-04-24T16:18:17Z",
    "build_snapshot" : false,
    "lucene_version" : "5.5.4"
  },
  "tagline" : "You Know, for Search"
}
Mevcut index kontrolü. Gördüğümüz gibi daha indeximiz yok.
$ curl localhost:9200/_cat/indices
Dinlenen IP ve port kontrolü.
$ netstat -pltn
Proto Recv-Q Send-Q Local Address           Foreign Address         State       PID/Program name
tcp6       0      0 127.0.0.1:9200          :::*                    LISTEN      -
Kibana
Kaynak listesini yaratma.
$ echo "deb http://packages.elastic.co/kibana/4.5/debian stable main" | sudo tee -a /etc/apt/sources.list
Kütüphaneyi yenileme.
$ sudo apt-get -y update
Kurulum.
$ sudo apt-get -y install kibana
Konfigürasyon.
$ sudo nano /opt/kibana/config/kibana.yml
server.port: 5601
server.host: "0.0.0.0"
Başlatma.
$ sudo service kibana start
Dinlenen IP ve port kontrolü.
$ netstat -pltn
Proto Recv-Q Send-Q Local Address           Foreign Address         State       PID/Program name
tcp        0      0 0.0.0.0:5601            0.0.0.0:*               LISTEN      -
Mevcut index kontrolü. Gördüğümüz gibi varsayılan "kibana" indeximiz yaratıldı.
$ curl localhost:9200/_cat/indices
yellow open .kibana 1 1 1 0 3kb 3kb
Tarayıcıdan http://192.168.50.40:5601 adresine giderek web arayüzüne ulaşabilirsiniz. İçinde bulunduğumuz anda herhangi bir index modeli bulunmayacak.
Kibana arayüzünde kullanmak için Filebeat index kalıbını indirme.
$ curl -L -O https://download.elastic.co/beats/dashboards/beats-dashboards-1.2.2.zip
$ sudo apt-get -y install unzip
$ unzip beats-dashboards-1.2.2.zip
Filebeat index kalıplarını Elasticsearch'e yükleme. Aşağıdaki işlem "packetbeat-*", "topbeat-*", "filebeat-*" ve "winlogbeat-*" index kalıplarını Kibana arayüzüne ekleyecektir. Sol taraftaki menüde listeyi görebilirsiniz.
$ cd beats-dashboards-1.2.2
$ ./load.sh
Filebeat index kalıbını yükleyerek, Elasticsearch'ün Filebeat ile gönderilen logları analiz etmesini sağlayalalım.
$ curl -O https://gist.githubusercontent.com/thisismitch/3429023e8438cc25b86c/raw/d8c479e2a1adcea8b1fe86570e42abab0f10f364/filebeat-index-template.json
Kalıbı yüklemek.
$ curl -XPUT "http://localhost:9200/_template/filebeat?pretty" -d@filebeat-index-template.json
{
  "acknowledged" : true
}
Logstash
Kaynak listesini yaratma.
$ echo "deb http://packages.elastic.co/logstash/2.3/debian stable main" | sudo tee -a /etc/apt/sources.list
Kütüphaneyi yenileme.
$ sudo apt-get -y update
Kurulum.
$ sudo apt-get -y install logstash
Test amacıyla aşağıdaki konfigürasyon log mesajlarını elasticsearch yerine terminale yazacak.
$ sudo nano /etc/logstash/conf.d/web-apache-access.conf
input {
    beats {
        port => 5044
    }
}

filter {
    grok {
        match => { "message" => "%{COMBINEDAPACHELOG}" }
    }
}

output {
    elasticsearch {
        hosts => ["localhost:9200"]
        sniffing => true
        manage_template => false
        index => "web-apache-access"
        #document_type => "apache_logs" # This is unnecessary
    }
}
Apache loglarının grok regexi COMBINEDAPACHELOG aşağıdaki gibidir. Detaylı bilgi için grok-patterns sayfasına bakabilirsiniz.
COMMONAPACHELOG %{IPORHOST:clientip} %{USER:ident} %{USER:auth} \[%{HTTPDATE:timestamp}\] "(?:%{WORD:verb} %{NOTSPACE:request}(?: HTTP/%{NUMBER:httpversion})?|%{DATA:rawrequest})" %{NUMBER:response} (?:%{NUMBER:bytes}|-)
COMBINEDAPACHELOG %{COMMONAPACHELOG} %{QS:referrer} %{QS:agent}
Yukarıda gördüğümüz gibi aşağıdaki alanlar elasticsearch indexi içinde yaratılıyor ve de siz bunları Kibana içinde grafik yaratmak için kullanabilirsiniz.
clientip
ident
auth
timestamp
verb
request
httpversion
rawrequest
response
bytes
referrer
agent
Konfigürasyon dosyasını doğrulama 10 saniye alır.
$ sudo /opt/logstash/bin/logstash --configtest -f /etc/logstash/conf.d/web-apache-access.conf
Configuration OK
Başlatma.
$ sudo service logstash start
Dinlenen IP ve port kontrolü.
$ netstat -pltn
Proto Recv-Q Send-Q Local Address           Foreign Address         State       PID/Program name
tcp6       0      0 :::5044                 :::*                    LISTEN      -
TCP 5044 portunu açıp, iptables içindeki INPUT bölümüne ekleyelim. Bu işlem dışarıdan TCP 5044 portuna gelen isteklerini kabul edecektir.
$ sudo iptables -A INPUT -p tcp --dport 5044 -j ACCEPT
Gördüğümüz gibi TCP 5044 port geçici olarak iletişime açılmış durumda. Daha sonradan bunu sürekli olarak açık hale getireceğiz.
$ sudo iptables -L
Chain INPUT (policy ACCEPT)
target     prot opt source               destination
ACCEPT     tcp  --  anywhere             anywhere             tcp dpt:5044
Iptables değişikliğini sürekli hale getirmek için iptables-persistent ekini yükleyelim.
$ sudo apt-get install iptables-persistent
Iptables değişikliğini kaydedelim.
$ sudo invoke-rc.d iptables-persistent save
* Saving rules...
*  IPv4...
*  IPv6...
Mevcut index kontrolü. Aşağıda gördüğümüz gibi sadece "kibana" indeximiz var.
$ curl localhost:9200/_cat/indices
yellow open .kibana 1 1 1 0 3kb 3kb
WEB sunucusu
ELK sunucusu port ulaşımı
Aşağıda da gördüğümüz gibi, ELK sunucusunun 5044 numaralı portu WEB sunucusundan gelen iletişim isteklerine açılmış durumda.
$ telnet 192.168.50.40 5044
Trying 192.168.50.40...
Connected to 192.168.50.40.
Escape character is '^]'.
Filebeat
Kaynak listesini yaratma.
$ echo "deb https://packages.elastic.co/beats/apt stable main" | sudo tee -a /etc/apt/sources.list.d/beats.list
Public key eklemesi.
$ wget -qO - https://packages.elastic.co/GPG-KEY-elasticsearch | sudo apt-key add -
Kütüphaneyi yenileme.
$ sudo apt-get -y update
Kurulum.
$ sudo apt-get -y install filebeat
Logları ELK sunucusundaki Logstash'a yönlendirmek için ayar yapalım.
$ sudo nano /etc/filebeat/filebeat.yml
filebeat:
    prospectors:
        paths:
            - /var/log/apache2/access.log
        input_type: log
output:
    # elasticsearch:
        # hosts: ["localhost:9200"]
    logstash:
        hosts: ["192.168.50.40:5044"]
Filebeat'i çalıştırır çalıştırmaz, ELK sunucunda Elasticsearch "web-apache-access" indexi yaratılmış olacak.
$ sudo service filebeat start
ELK sunucusu
Index
Aşağıda da gördüğümüz gibi Filebeat ile alakalı olan "web-apache-access" index yaratılmış durumda.
$ curl localhost:9200/_cat/indices
yellow open .kibana           1 1 103 0 94.7kb 94.7kb
yellow open web-apache-access 5 1   4 0 25.5kb 25.5kb
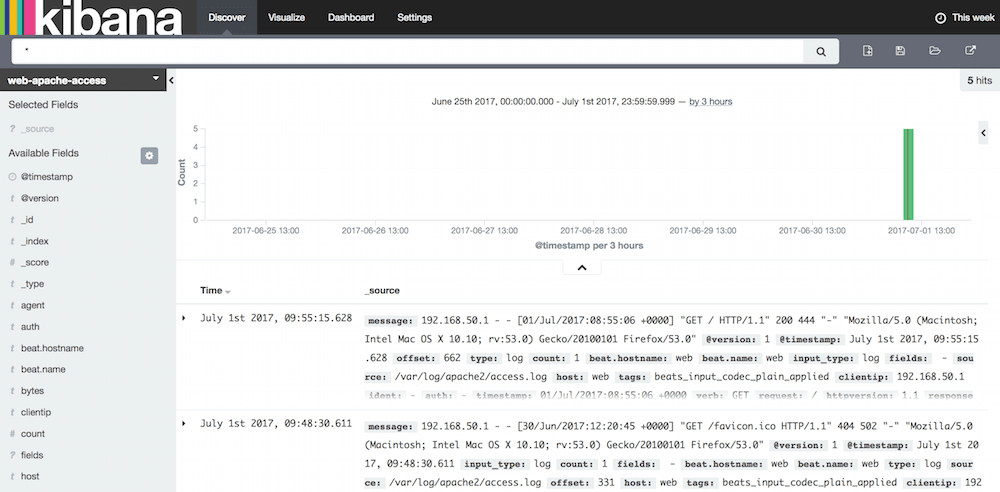
Kibana arayüz kurulumu
- Web arayüzüne ulaşmak için
http://192.168.50.40:5601adresine gidin. - "Index name or pattern" alanına "web-apache-access" yazın.
- "Create" butonun görünmesini bekleyin ve sonra basın.


Elasticsearch index içeriği
$ curl -XGET localhost:9200/web-apache-access/_search?pretty=1
{
  "took": 4,
  "timed_out": false,
  "_shards": {
    "total": 5,
    "successful": 5,
    "failed": 0
  },
  "hits": {
    "total": 5,
    "max_score": 1.0,
    "hits": [
      {
        "_index": "web-apache-access",
        "_type": "apache_logs",
        "_id": "AVz66LnCUo6EnAM7FtHn",
        "_score": 1.0,
        "_source": {
          "message": "192.168.50.1 - - [30/Jun/2017:12:20:45 +0000] \"GET /favicon.ico HTTP/1.1\" 404 ...",
          "@version": "1",
          "@timestamp": "2017-07-01T08:48:30.610Z",
          "offset": 160,
          "input_type": "log",
          "count": 1,
          "fields": null,
          "source": "/var/log/apache2/access.log",
          "type": "log",
          "beat": {
            "hostname": "web",
            "name": "web"
          },
          "host": "web",
          "tags": [
            "beats_input_codec_plain_applied"
          ],
          "clientip": "192.168.50.1",
          "ident": "-",
          "auth": "-",
          "timestamp": "30/Jun/2017:12:20:45 +0000",
          "verb": "GET",
          "request": "/favicon.ico",
          "httpversion": "1.1",
          "response": "404",
          "bytes": "502",
          "referrer": "\"-\"",
          "agent": "\"Mozilla/5.0 (Macintosh; Intel Mac OS X 10.10; rv:53.0) Gecko/20100101 Firefox/53.0\""
        }
      },
      {
        "_index": "web-apache-access",
        "_type": "apache_logs",
        "_id": "AVz66LnCUo6EnAM7FtHp",
        "_score": 1.0,
        "_source": {
          "message": "192.168.50.1 - - [01/Jul/2017:08:26:07 +0000] \"GET / HTTP/1.1\" 200 444 \"-\" \"Mozilla/5.0  ...",
          "@version": "1",
          "@timestamp": "2017-07-01T08:48:30.611Z",
          "source": "/var/log/apache2/access.log",
          "offset": 502,
          "type": "log",
          "input_type": "log",
          "fields": null,
          "count": 1,
          "beat": {
            "hostname": "web",
            "name": "web"
          },
          "host": "web",
          "tags": [
            "beats_input_codec_plain_applied"
          ],
          "clientip": "192.168.50.1",
          "ident": "-",
          "auth": "-",
          "timestamp": "01/Jul/2017:08:26:07 +0000",
          "verb": "GET",
          "request": "/",
          "httpversion": "1.1",
          "response": "200",
          "bytes": "444",
          "referrer": "\"-\"",
          "agent": "\"Mozilla/5.0 (Macintosh; Intel Mac OS X 10.10; rv:53.0) Gecko/20100101 Firefox/53.0\""
        }
      }
    ]
  }
}
Elasticsearch index haritası
$ curl -X GET localhost:9200/_mapping/apache_logs?pretty
{
  "web-apache-access": {
    "mappings": {
      "apache_logs": {
        "properties": {
          "@timestamp": {
            "type": "date",
            "format": "strict_date_optional_time||epoch_millis"
          },
          "@version": {
            "type": "string"
          },
          "agent": {
            "type": "string"
          },
          "auth": {
            "type": "string"
          },
          "beat": {
            "properties": {
              "hostname": {
                "type": "string"
              },
              "name": {
                "type": "string"
              }
            }
          },
          "bytes": {
            "type": "string"
          },
          "clientip": {
            "type": "string"
          },
          "count": {
            "type": "long"
          },
          "host": {
            "type": "string"
          },
          "httpversion": {
            "type": "string"
          },
          "ident": {
            "type": "string"
          },
          "input_type": {
            "type": "string"
          },
          "message": {
            "type": "string"
          },
          "offset": {
            "type": "long"
          },
          "referrer": {
            "type": "string"
          },
          "request": {
            "type": "string"
          },
          "response": {
            "type": "string"
          },
          "source": {
            "type": "string"
          },
          "tags": {
            "type": "string"
          },
          "timestamp": {
            "type": "string"
          },
          "type": {
            "type": "string"
          },
          "verb": {
            "type": "string"
          }
        }
      }
    }
  }
}