Using Fluent-Bit to forward Docker PHP-FPM and Nginx logs to Elasticsearch
15/06/2019 - DOCKER, ELASTICSEARCH, NGINX
In this example we are going to forward our PHP-FPM and Nginx logs to Elasticsearch. In order to do that we will be using Fluent-Bit. Our monitoring stack is EFK (Elasticsearch Fluent-Bit Kibana). The reason we are not using FileBeat and Logstash is because Fluent-Bit is very very light weight on system resources. We are talking about barely a few KB/MB compared to hundreds of MBs!!! It has build-in persistence mechanism as well such as memory and filesystem. FileBeat and Logstash solution will require something like Redis for persistence.
Flow
PHP-FPM and Nginx logs are being watched by Fluent-Bit then get forwarded to Elasticsearch. As simple as that!
Application setup
Structure
.
├── docker
│   ├── docker-compose.yml
│   ├── nginx
│   │   ├── app.conf
│   │   ├── Dockerfile
│   │   └── nginx.conf
│   └── php
│       ├── Dockerfile
│       ├── php.ini
│       └── www.conf
└── index.php
docker/docker-compose.yml
Fluentd logging driver options can be find here and here.
version: "3.4"

services:

  inanzzz_wait_php:
    build:
      context: "./php"
    hostname: "wait-php"
    volumes:
      - "..:/app"
    environment:
      PS1: "\\u@\\h:\\w\\$$ "
    logging:
      driver: "fluentd"
      options:
        fluentd-address: "inanzzz_monitoring_fluent_bit"
        tag: "wait_php"
        mode: "non-blocking"
        max-buffer-size: "2m"
        fluentd-async-connect: "true"

  inanzzz_wait_nginx:
    build:
      context: "./nginx"
    hostname: "wait-nginx"
    ports:
      - "1080:80"
    volumes:
      - "..:/app"
    depends_on:
      - "inanzzz_wait_php"
    environment:
      PS1: "\\u@\\h:\\w\\$$ "
    logging:
      driver: "fluentd"
      options:
        fluentd-address: "inanzzz_monitoring_fluent_bit"
        tag: "wait_nginx"
        mode: "non-blocking"
        max-buffer-size: "2m"
        fluentd-async-connect: "true"
docker/nginx/app.conf
server {
    listen 80 default_server;

    server_name localhost;

    root /app;

    index index.php;

    location ~ \.php$ {
        try_files $uri =404;
        fastcgi_pass inanzzz_wait_php:9000;
        fastcgi_split_path_info ^(.+\.php)(/.+)$;
        fastcgi_index index.php;
        include fastcgi_params;
        fastcgi_param SCRIPT_FILENAME $document_root$fastcgi_script_name;
        fastcgi_param PATH_INFO $fastcgi_path_info;
        fastcgi_param HTTP_X_REQUEST_ID $request_id;
    }
}
docker/nginx/Dockerfile
FROM nginx:1.15.8-alpine

WORKDIR /app

COPY app.conf /etc/nginx/conf.d/default.conf
COPY nginx.conf /etc/nginx/nginx.conf
docker/nginx/nginx.conf
user nginx;

worker_processes 1;

error_log /var/log/nginx/error.log warn;
pid /var/run/nginx.pid;

events {
    worker_connections 1024;
}

http {
    include /etc/nginx/mime.types;
    default_type application/octet-stream;

    log_format json_combined escape=json
          '{'
            '"time_local":"$time_iso8601",'
            '"client_ip":"$http_x_forwarded_for",'
            '"remote_addr":"$remote_addr",'
            '"remote_user":"$remote_user",'
            '"request":"$request",'
            '"status":"$status",'
            '"body_bytes_sent":"$body_bytes_sent",'
            '"request_time":"$request_time",'
            '"http_referrer":"$http_referer",'
            '"http_user_agent":"$http_user_agent",'
            '"request_id":"$request_id"'
          '}';

    access_log /var/log/nginx/access.log json_combined;

    error_log off;

    sendfile on;

    keepalive_timeout 65;

    include /etc/nginx/conf.d/*.conf;
}
docker/php/Dockerfile
FROM php:7.2.13-fpm-alpine3.8

WORKDIR /app

COPY php.ini /usr/local/etc/php/conf.d/php.override.ini
COPY www.conf /usr/local/etc/php-fpm.d/www.conf

CMD ["php-fpm", "--nodaemonize"]
docker/php/php.ini
[PHP]
date.timezone=UTC
log_errors=On
error_reporting=E_ALL & ~E_DEPRECATED & ~E_STRICT
display_errors=Off
max_execution_time=60
memory_limit=256M
docker/php/www.conf
[global]
daemonize=no

[www]
user=www-data
group=www-data

listen=inanzzz_wait_nginx:9000

pm=dynamic
pm.max_children=40
pm.start_servers=2
pm.min_spare_servers=2
pm.max_spare_servers=4
pm.max_requests=500

access.format='{"time_local":"%{%Y-%m-%dT%H:%M:%S%z}T","client_ip":"%{HTTP_X_FORWARDED_FOR}e","remote_addr":"%R","remote_user":"%u","request":"%m %{REQUEST_URI}e %{SERVER_PROTOCOL}e","status":"%s","body_bytes_sent":"%l","request_time":"%d","http_referrer":"%{HTTP_REFERER}e","http_user_agent":"%{HTTP_USER_AGENT}e","request_id":"%{HTTP_X_REQUEST_ID}e"}'
Monitoring setup
Structure
├── data
├── docker-compose.yml
└── fluent-bit.conf
docker-compose.yml
version: "3.4"

services:

  inanzzz_monitoring_elasticsearch:
    image: "docker.elastic.co/elasticsearch/elasticsearch:7.1.1"
    hostname: "monitoring-elasticsearch"
    environment:
      node.name: "monitoring_node"
      discovery.type: "single-node"
      cluster.name: "monitoring_cluster"
      bootstrap.memory_lock: "true"
      ES_JAVA_OPTS: "-Xms512m -Xmx512m"
      PS1: "\\u@\\h:\\w\\$$ "
    ulimits:
      memlock:
        soft: "-1"
        hard: "-1"
    ports:
      - "9200:9200"
    volumes:
      - "./data/elasticsearch:/usr/share/elasticsearch/data"

  inanzzz_monitoring_fluent_bit:
    image: "fluent/fluent-bit:1.0.4"
    hostname: "monitoring-fluent-bit"
    ports:
      - "24224:24224"
    depends_on:
      - "inanzzz_monitoring_elasticsearch"
    volumes:
      - "./fluent-bit.conf:/fluent-bit/etc/fluent-bit.conf:ro"

  inanzzz_monitoring_kibana:
    image: "docker.elastic.co/kibana/kibana:7.1.1"
    hostname: "monitoring-kibana"
    environment:
      ELASTICSEARCH_HOSTS: "http://inanzzz_monitoring_elasticsearch:9200"
    ports:
      - "5601:5601"
    depends_on:
      - "inanzzz_monitoring_elasticsearch"

  inanzzz_monitoring_elastichq:
    image: "elastichq/elasticsearch-hq"
    hostname: "monitoring-elastichq"
    ports:
      - "5000:5000"
    depends_on:
      - "inanzzz_monitoring_elasticsearch"
fluent-bit.conf
If the incoming log flow is not too intense you can get remove all storage.* keys. The persistence will fallback to memory which is default.
[SERVICE]
    Flush                     5
    Daemon                    Off
    Log_Level                 debug
    storage.path              /var/log/flb-storage
    storage.sync              normal
    storage.checksum          off
    storage.backlog.mem_limit 5M

[INPUT]
    Name         forward
    storage.type filesystem
    Listen       inanzzz_monitoring_fluent_bit
    Port         24224

[OUTPUT]
    Name            es
    Host            inanzzz_monitoring_elasticsearch
    Port            9200
    Match           wait_*
    Index           wait
    Type            logs
    Include_Tag_Key On
    Tag_Key         tag
You can use $ curl -X GET 0.0.0.0:9200/_cat/indices to list all indexes and $ curl -X GET 0.0.0.0:9200/wait/_search to see the content of wait index. Also Kibana is accessible via http://localhost:5601 and ElasticHQ via http://192.168.99.30:5000.
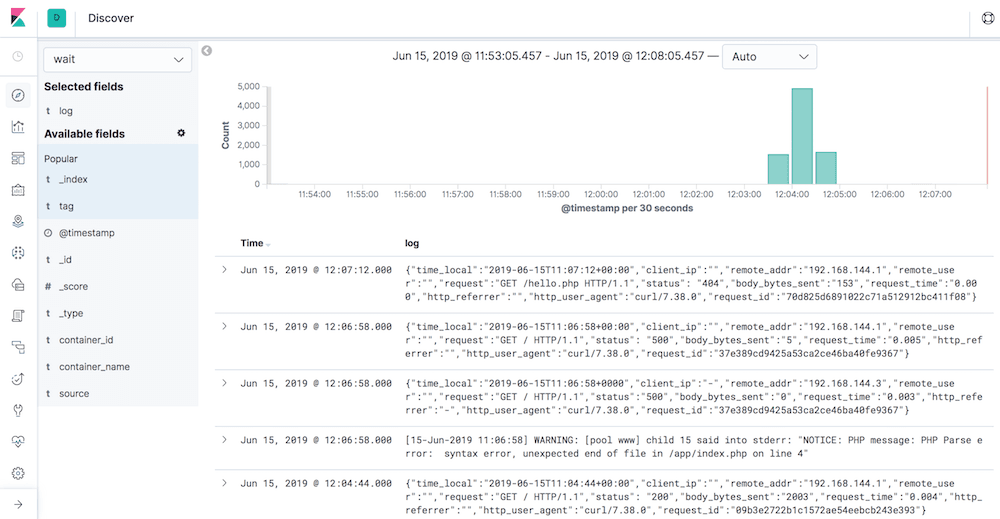
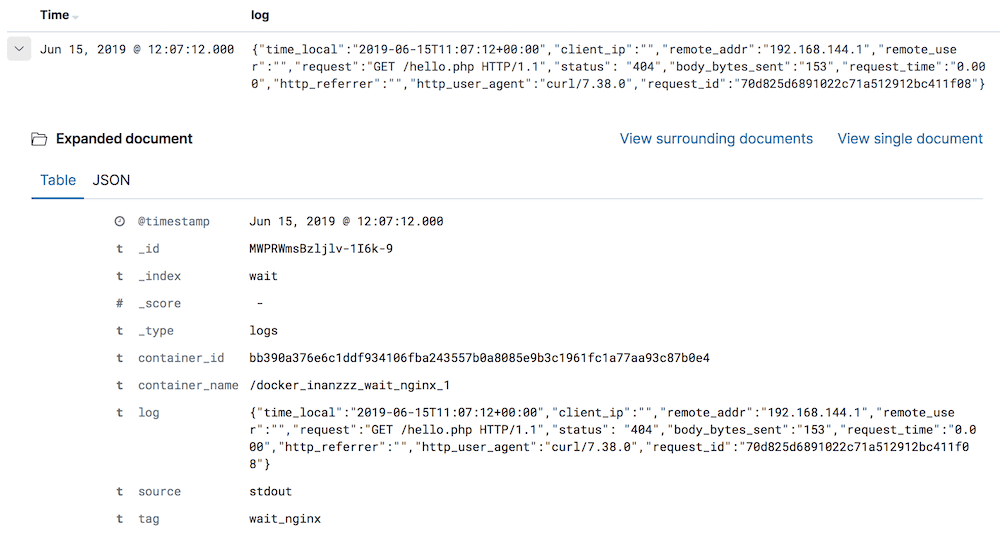
Tests
Send some requests to your application. The result should look similar to one below.
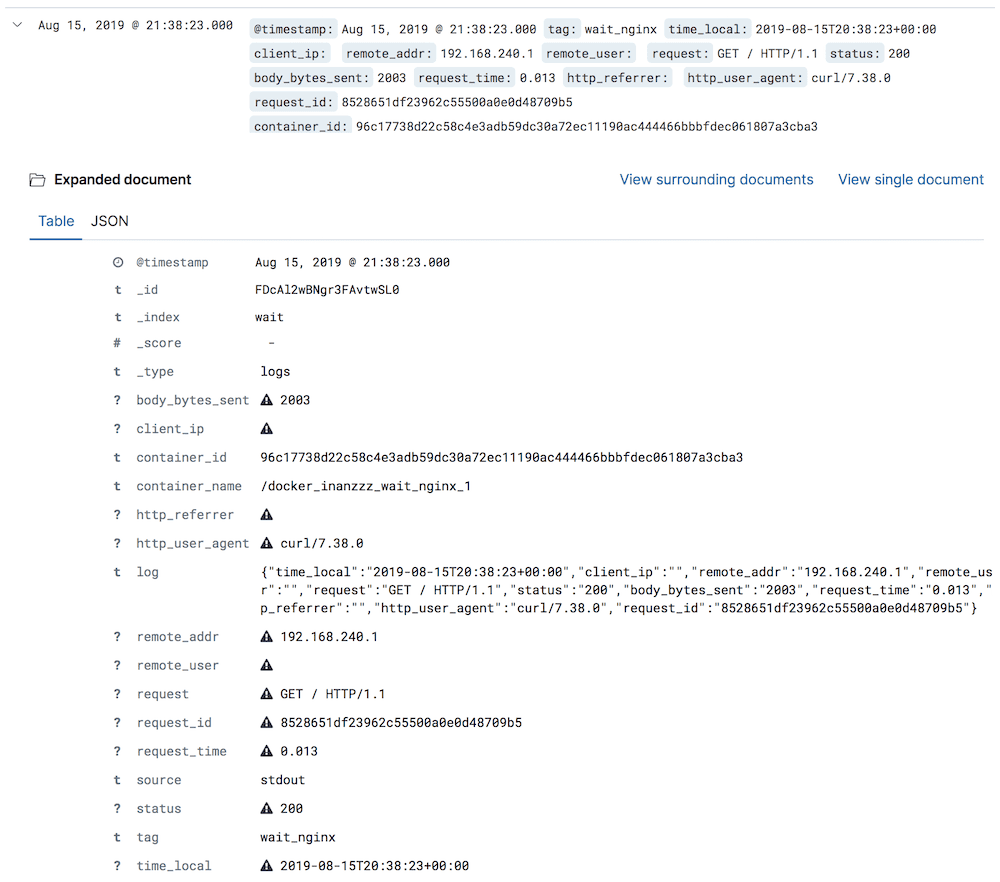
Splitting logs
Use example below to split log string into individual log fields so that searching, reporting and visualising becomes easier. This is the preferred config you should use.
fluent-bit.conf
[SERVICE]
    Flush                     5
    Daemon                    Off
    Log_Level                 debug
    storage.path              /var/log/flb-storage
    storage.sync              normal
    storage.checksum          off
    storage.backlog.mem_limit 5M
    Parsers_File              parsers.conf

[INPUT]
    Name         forward
    storage.type filesystem
    Listen       inanzzz_monitoring_fluent_bit
    Port         24224

[FILTER]
    Name         parser
    Parser       docker
    Match        wait_*
    Key_Name     log
    Reserve_Data On
    Preserve_Key On

[OUTPUT]
    Name            es
    Host            inanzzz_monitoring_elasticsearch
    Port            9200
    Match           wait_*
    Index           wait
    Type            logs
    Include_Tag_Key On
    Tag_Key         tag
parsers.conf
# When this is used, empty fields are removed from the log so we are missing value.
[PARSER]
    Name   json_regex
    Format regex
    Regex  ^{"time_local":"(?<time_local>.*?)","client_ip":"(?<client_ip>.*?)","remote_addr":"(?<remote_addr>.*?)","remote_user":"(?<remote_user>.*?)","request":"(?<request>.*?)","status":"(?<status>.*?)","body_bytes_sent":"(?<body_bytes_sent>.*?)","request_time":"(?<request_time>.*?)","http_referrer":"(?<http_referrer>.*?)","http_user_agent":"(?<http_user_agent>.*?)","request_id":"(?<request_id>.*?)"}$

# This doesn't have the problem mentioned above so this is the preferred choice.
[PARSER]
    Name         docker
    Format       json
    Time_Key     time
    Time_Format  %Y-%m-%dT%H:%M:%S.%L
    Time_Keep    On
    # Command      |  Decoder | Field | Optional Action
    # =============|==================|=================
    Decode_Field_As   escaped_utf8    log    do_next
    Decode_Field_As   json       log
Outcome