InfluxDB and Grafana integration
08/09/2017 - LINUX
In this example, we're going to install InfluxDB and Grafana on same machine (Ubuntu 16.04) then configure both so that Grafana can visualise data stored in InfluxDB. We will be using InfluxDB version 1.3.5 and Grafana version 4.4.3.
InfluxDB
Information
At the time of writing this post, InfluxDB was considered as the best and most performant timeseries data storage.
By default, InfluxDB uses:
- TCP port 8086 for client-server communication over InfluxDB's HTTP API.
- TCP port 8088 for the RPC service for backup and restore purposes.
You can configure port mapping and other properties through /etc/influxdb/influxdb.conf file. You can see the logs by running journalctl -u influxdb command.
Note: If data is pushed to InfluxDB from other host machines, you must synchronize time between all hosts with Network Time Protocol (NTP). If you don't do it, the timestamps on the data written to InfluxDB can be inaccurate. Timestamp data is stored as in UTC format. You can use date command to check the time.
If you wish, you can install and use Chronograf as web based GUI for InfluxDB.
Installation
Add the InfluxDB repository.
$ curl -sL https://repos.influxdata.com/influxdb.key | sudo apt-key add -
$ source /etc/lsb-release
$ echo "deb https://repos.influxdata.com/${DISTRIB_ID,,} ${DISTRIB_CODENAME} stable" | sudo tee /etc/apt/sources.list.d/influxdb.list
Install and start the InfluxDB service.
$ sudo apt-get update
$ sudo apt-get install influxdb
$ sudo service influxdb start
If you run influxd command, you'll see basic details about the service. If you run influxd config command, you'll see service's default configurations.
Note: By default, you can login to database without going through the authentication then run any queries you wish. We will enable authentication later on.
Connection
Connect to database.
$ influx
Connected to http://localhost:8086 version 1.3.5
InfluxDB shell version: 1.3.5
>
Check current users. By default, there won't be any user defined.
> SHOW USERS
user admin
---- -----
>
Check current databases.
> SHOW DATABASES
name: databases
name
----
_internal
>
List tables in _internal database.
> USE _internal
Using database _internal
> SHOW MEASUREMENTS
name: measurements
name
----
cq
database
httpd
queryExecutor
runtime
shard
subscriber
tsm1_cache
tsm1_engine
tsm1_filestore
tsm1_wal
write
>
Query httpd table in _internal database.
> SELECT * FROM httpd
>
Exit influxDB.
> EXIT
User authentication
Do the following to prevent unauthenticated access to database. We will create an admin user and let only admin user to access to database with username and password.
Create an admin user with all privileges.
$ influx
Connected to http://localhost:8086 version 1.3.5
InfluxDB shell version: 1.3.5
>
> CREATE USER inanzzz WITH PASSWORD '123123' WITH ALL PRIVILEGES
>
> SHOW USERS
user    admin
----    -----
inanzzz true
>
> EXIT
Look for auth-enabled in /etc/influxdb/influxdb.conf configuration file and set it as auth-enabled = true in order to enable authentication.
Restart the service.
$ sudo service influxdb restart
Testing without username and password doesn't even let us list databases anymore.
$ influx
Connected to http://localhost:8086 version 1.3.5
InfluxDB shell version: 1.3.5
>
> SHOW DATABASES
ERR: unable to parse authentication credentials
Warning: It is possible this error is due to not setting a database.
Please set a database with the command "use".
Testing with authentication works as expected.
$ influx -username inanzzz -password 123123
Connected to http://localhost:8086 version 1.3.5
InfluxDB shell version: 1.3.5
>
> SHOW DATABASES
name: databases
name
----
_internal
>
Writing data
In example below we are going to create:
- a database called
server_stats - a table called
cpu
to store some statistics about CPU.
Then we are going to assign:
- a tag called
host - a tag called
region
to use in our queries. It will help us differentiate stats per host or region. Then we are going to assign float data to value field as stat.
Note: If you want, you can manually provide Unix nanosecond timestamp with the data. If you don't, system's time will be used.
If we're to explain it in more technical way, it would be something like below.
SELECT value FROM server_stats.cpu WHERE host = 'server01'
SELECT value FROM server_stats.cpu WHERE host = 'server01' AND/OR region = 'europa'
Create database.
$ curl -i -XPOST http://localhost:8086/query -u inanzzz:123123 --data-urlencode "q=CREATE DATABASE server_stats"
Create table and populate with dummy data. It creates table only if it doesn't exist.
$ curl -i -XPOST 'http://localhost:8086/write?db=server_stats' -u inanzzz:123123 --data-binary 'cpu,host=server01,region=europa value=0.01 1504879906'
$ curl -i -XPOST 'http://localhost:8086/write?db=server_stats' -u inanzzz:123123 --data-binary 'cpu,host=server01,region=europa value=0.01 1504879943'
$ curl -i -XPOST 'http://localhost:8086/write?db=server_stats' -u inanzzz:123123 --data-binary 'cpu,host=server01,region=europa value=0.02'
$ curl -i -XPOST 'http://localhost:8086/write?db=server_stats' -u inanzzz:123123 --data-binary 'cpu,host=server02,region=europa value=1.00 1504879906'
$ curl -i -XPOST 'http://localhost:8086/write?db=server_stats' -u inanzzz:123123 --data-binary 'cpu,host=server02,region=europa value=1.00 1504879943'
$ curl -i -XPOST 'http://localhost:8086/write?db=server_stats' -u inanzzz:123123 --data-binary 'cpu,host=server02,region=europa value=2.00'
As you can see above and confirm below, we inserted dummy data that belongs to server01 and server02 hosts in same europa region. The first two data sets for each hosts are based on same time and the last sets are based on different times.
$ influx -username inanzzz -password 123123
Connected to http://localhost:8086 version 1.3.5
InfluxDB shell version: 1.3.5
>
> SHOW DATABASES
name: databases
name
----
_internal
server_stats
>
> USE server_stats
Using database server_stats
>
> SHOW MEASUREMENTS
name: measurements
name
----
cpu
>
> SELECT * FROM cpu
name: cpu
time                host     region value
----                ----     ------ -----
1504879906          server01 europa 0.01
1504879906          server02 europa 1
1504879943          server01 europa 0.01
1504879943          server02 europa 1
1504880003297061860 server01 europa 0.02
1504880123219102389 server02 europa 2
Links
- InfluxDB
- Installation
- Chronograf (Web GUI)
- Authentication
- Schema exploration (CLI/CURL)
- User management commands
- Writing data
- Querying data
Grafana
Information
Apart from visualising the data, you can also use it trigger alerts such as Slack, email etc.
Installation
Download package.
$ wget https://s3-us-west-2.amazonaws.com/grafana-releases/release/grafana_4.4.3_amd64.deb
$ sudo apt-get install -y adduser libfontconfig
$ sudo dpkg -i grafana_4.4.3_amd64.deb
Add the InfluxDB repository.
$ echo "deb https://packagecloud.io/grafana/stable/debian/ jessie main" | sudo tee -a /etc/apt/sources.list
$ curl https://packagecloud.io/gpg.key | sudo apt-key add -
Install and start Grafana service.
$ sudo apt-get update
$ sudo apt-get install grafana
$ sudo service grafana-server start
Web GUI
Browse to http://192.168.99.30:3000 and login with admin:admin.
Links
Integration
Access GUI
Go to http://192.168.99.30:3000 and login with admin:admin.

Add Data Source
- Click Grafana icon in the top header and select "Data Sources" option.
- Click "Add data source" button in the page.
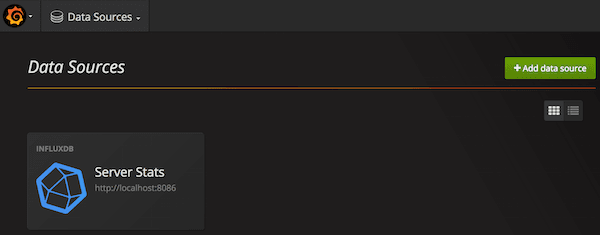
- Fill the fields in as you see in the image below and click "Add" button.

If you click Grafana icon in the top header and select "Data Sources", you should see image below.
Add Dashboard
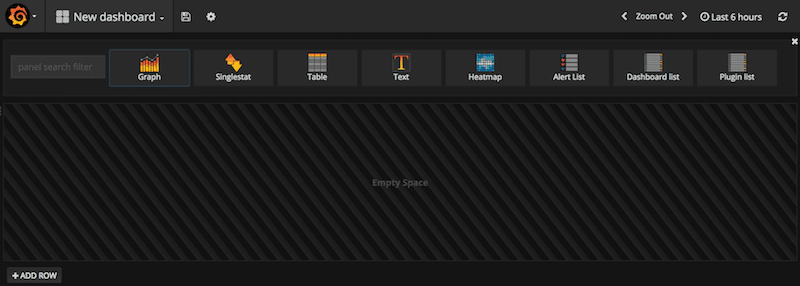
- Click Grafana icon in the top header, select "Dashboard" option then "New".
- Click "Graph" icon in the page.
- Click "Panel Title" header of the graph and select "Edit".
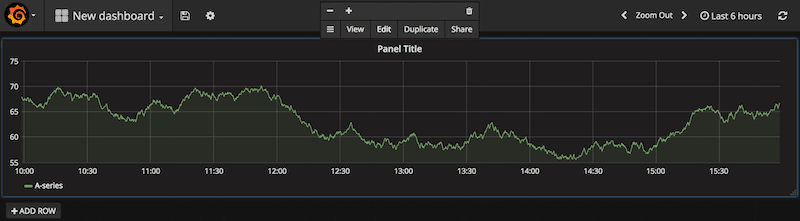
- Configure "Metrics" as seen image below.
- Save it as "Host stats" by clicking disk icon on top of the page. This will produce graph below.

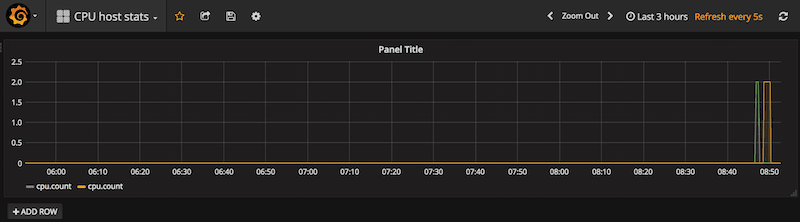
If you enable graph's auto-refresh option and populate influxDB with more data, you would see the graph changing in real time. You can run command below to add more data against server02 host and look at the graph for testing purposes.
$ for((i=1;i<=10;i+=1)); do curl -XPOST "http://localhost:8086/write?db=server_stats" -u inanzzz:123123 --data-binary "cpu,host=server02,region=europa value=$i.00"; sleep 5; done
Graph should look like image below.

Links