Setting up Elasticsearch, Logstash and Kibana (ELK Stack) on Ubuntu 14.04
29/06/2017 - ELASTICSEARCH, LINUX
In this example we are going to setup Elasticsearch Logstash Kibana (ELK stack) on Ubuntu 14.04 server. For the testing purposes, we will configure Logstash to watch regular Apache access logs. You can add more configurations to watch other logs such as your website logs, syslog etc.
Flow
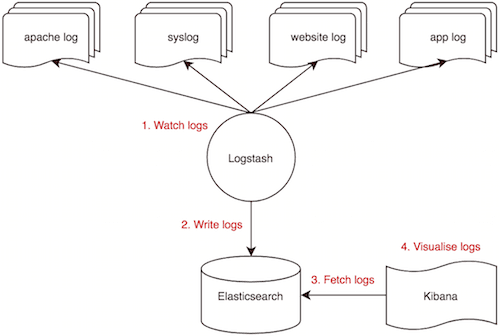
This is how the system works.
System
Our ELK stack setup has three components as shown below.
- Logstash: Used to process incoming logs. Version 2.3.4
- Elasticsearch: Stores the logs. Version 2.4.5
- Kibana: Web GUI for searching and visualising logs. Version 4.5.4
Additionally we have two server components as shown below. Our server's IP is 192.168.50.40.
- Apache2 version 2.4.7
- Java 8 version 1.8.0_131
Operating system
Updating repository database.
$ sudo apt-get -y update
Apache
Install.
$ sudo apt-get install -y apache2
Configuration.
$ sudo nano /etc/apache2/apache2.conf
ServerName localhost
Restart.
$ sudo service apache2 restart
Java
Adding repository source.
$ sudo add-apt-repository -y ppa:webupd8team/java
Updating repository database.
$ sudo apt-get -y update
Install.
$ sudo apt-get -y install oracle-java8-installer
Elasticsearch
Importing public key.
$ wget -qO - https://packages.elastic.co/GPG-KEY-elasticsearch | sudo apt-key add -
Creating source list.
$ echo "deb http://packages.elastic.co/elasticsearch/2.x/debian stable main" | sudo tee -a /etc/apt/sources.list.d/elasticsearch-2.x.list
Updating repository database.
$ sudo apt-get -y update
Installing.
$ sudo apt-get -y install elasticsearch
Configuration.
$ sudo nano /etc/elasticsearch/elasticsearch.yml
cluster.name: elk-cluster
node.name: elk-node
bootstrap.memory_lock: true
network.host: localhost
http.port: 9200
Starting.
$ sudo service elasticsearch start
Testing.
$ curl localhost:9200
{
  "name" : "elk-node",
  "cluster_name" : "elk-cluster",
  "cluster_uuid" : "Ocu_bS3jQ_G8rpAHVuRgBw",
  "version" : {
    "number" : "2.4.5",
    "build_hash" : "c849dd13904f53e63e88efc33b2ceeda0b6a1276",
    "build_timestamp" : "2017-04-24T16:18:17Z",
    "build_snapshot" : false,
    "lucene_version" : "5.5.4"
  },
  "tagline" : "You Know, for Search"
}
Check current indexes. Currently there is no index yet.
$ curl localhost:9200/_cat/indices
Verify listening IP and port.
$ netstat -pltn
Proto Recv-Q Send-Q Local Address           Foreign Address         State       PID/Program name
tcp6       0      0 127.0.0.1:9200          :::*                    LISTEN      -
Kibana
Creating source list.
$ echo "deb http://packages.elastic.co/kibana/4.5/debian stable main" | sudo tee -a /etc/apt/sources.list
Updating repository database.
$ sudo apt-get -y update
Installing.
$ sudo apt-get -y install kibana
Configuration.
$ sudo nano /opt/kibana/config/kibana.yml
server.port: 5601
server.host: "0.0.0.0"
Restart.
$ sudo service kibana start
Verify listening IP and port.
$ netstat -pltn
Proto Recv-Q Send-Q Local Address           Foreign Address         State       PID/Program name
tcp        0      0 0.0.0.0:5601            0.0.0.0:*               LISTEN      -
Check current indexes. As you can see below, default "kibana" index has been created.
$ curl localhost:9200/_cat/indices
yellow open .kibana 1 1 1 0 3kb 3kb
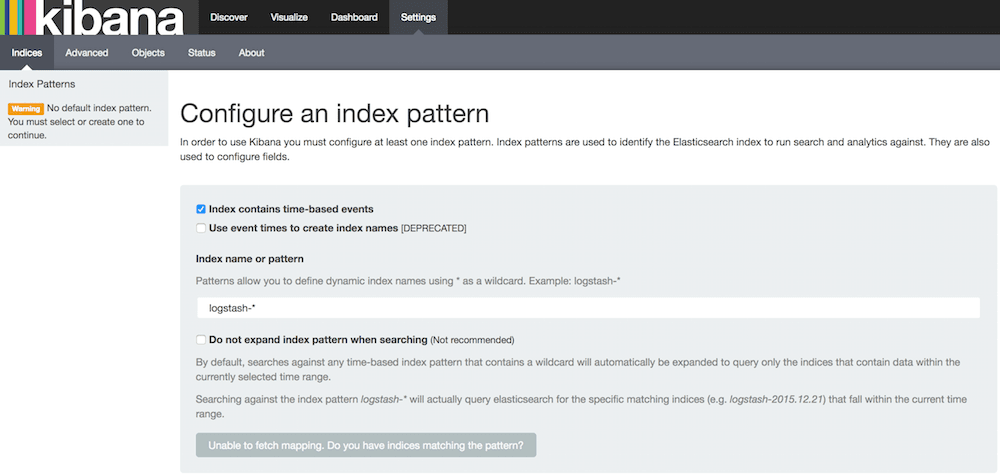
You should be able to access GUI via http://192.168.50.40:5601 from your browser. However, there won't be any index pattern available at this stage yet.
Logstash
Creating source list.
$ echo "deb http://packages.elastic.co/logstash/2.3/debian stable main" | sudo tee -a /etc/apt/sources.list
Updating repository database.
$ sudo apt-get -y update
Installing.
$ sudo apt-get -y install logstash
Configuration below will print logs to terminal instead of elasticsearch for testing purposes. Important: You must read up on start_position and use sincedb_path as well otherwise everytime you restart Logstash, you might end up reading previous log lines which would be a disaster! The beginning is mainly used for debugging purposes, not in production.
$ sudo nano /etc/logstash/conf.d/apache-access.conf
input {
    file {
        path => "/var/log/apache2/access.log"
        start_position => "beginning"
    }
}

filter {
    grok {
        match => { "message" => "%{COMBINEDAPACHELOG}" }
    }
}

output {
    stdout { codec => rubydebug }
}
The grok regex COMBINEDAPACHELOG for Apache logs looks like below. You can see in grok-patterns page.
COMMONAPACHELOG %{IPORHOST:clientip} %{USER:ident} %{USER:auth} \[%{HTTPDATE:timestamp}\] "(?:%{WORD:verb} %{NOTSPACE:request}(?: HTTP/%{NUMBER:httpversion})?|%{DATA:rawrequest})" %{NUMBER:response} (?:%{NUMBER:bytes}|-)
COMBINEDAPACHELOG %{COMMONAPACHELOG} %{QS:referrer} %{QS:agent}
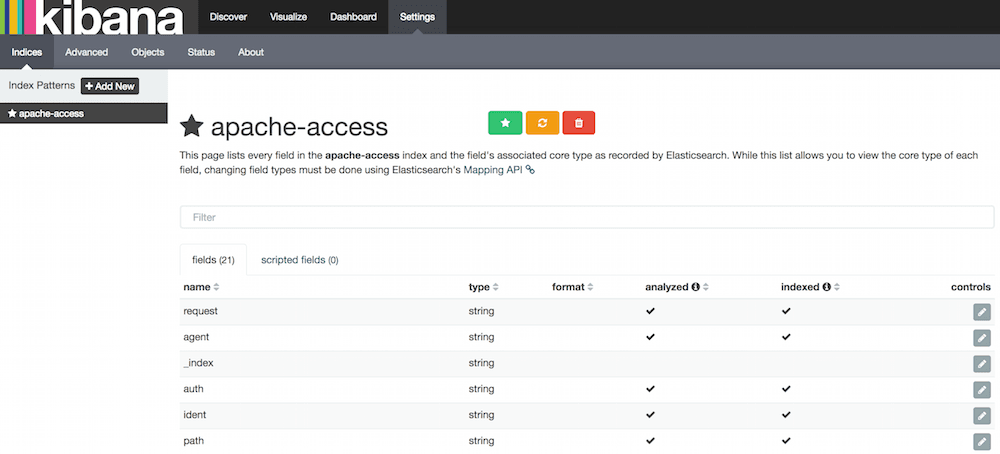
As you can see above, it creates fields below in elasticsearch index so you can use them in Kibana to create graphics.
clientip
ident
auth
timestamp
verb
request
httpversion
rawrequest
response
bytes
referrer
agent
Validating configuration file takes about 10 seconds to get confirmation.
$ sudo /opt/logstash/bin/logstash --configtest -f /etc/logstash/conf.d/
Configuration OK
Run command below to test configuration file and wait for "Logstash startup completed" message before calling http://192.168.50.40/ in your browser. The output in terminal should look like example output below.
$ sudo /opt/logstash/bin/logstash -f /etc/logstash/conf.d
Settings: Default pipeline workers: 2
Pipeline main started
{
        "message" => "192.168.50.1 - - [28/Jun/2017:22:08:31 +0000] \"GET / HTTP/1.1\" 200 3594 \"-\" \"Mozilla/5.0 (Macintosh; Intel Mac OS X 10.10; rv:53.0) Gecko/20100101 Firefox/53.0\"",
       "@version" => "1",
     "@timestamp" => "2017-06-28T22:08:32.192Z",
           "path" => "/var/log/apache2/access.log",
           "host" => "elk",
       "clientip" => "192.168.50.1",
          "ident" => "-",
           "auth" => "-",
      "timestamp" => "28/Jun/2017:22:08:31 +0000",
           "verb" => "GET",
        "request" => "/",
    "httpversion" => "1.1",
       "response" => "200",
          "bytes" => "3594",
       "referrer" => "\"-\"",
          "agent" => "\"Mozilla/5.0 (Macintosh; Intel Mac OS X 10.10; rv:53.0) Gecko/20100101 Firefox/53.0\""
}
Exiting command above with "ctrl+c" shuts down logstash so we need to start it again.
$ sudo service logstash start
Check current indexes. As you can see below, there is nothing apart from default "kibana" index.
$ curl localhost:9200/_cat/indices
yellow open .kibana 1 1 1 0 3kb 3kb
Modify configuration to insert logs into elasticsearch index.
$ sudo nano /etc/logstash/conf.d/apache-access.conf
...
output {
    elasticsearch {
        hosts => ["localhost:9200"]
        sniffing => true
        manage_template => false
        index => "apache-access"
        # document_type => "apache_logs" # This is unnecessary
    }
}
...
Validating configuration file takes about 10 seconds to get confirmation.
$ sudo /opt/logstash/bin/logstash --configtest -f /etc/logstash/conf.d/
Configuration OK
Restarting.
$ sudo service logstash stop
$ sudo service logstash start
Check current indexes. As you can see below, there is nothing apart from default "kibana" index because we haven't make a call to apache yet.
$ curl localhost:9200/_cat/indices
yellow open .kibana 1 1 1 0 3kb 3kb
Access http://192.168.50.40 from your browser and check current elasticsearch indexes again. As you can see below, our "apache-access" has been created as soon as we triggered a call against apache web server.
$ curl localhost:9200/_cat/indices
yellow open .kibana       1 1 1 0 3.1kb 3.1kb
yellow open apache-access 5 1 2 0   7kb   7kb
Kibana GUI
Setup
- Go to
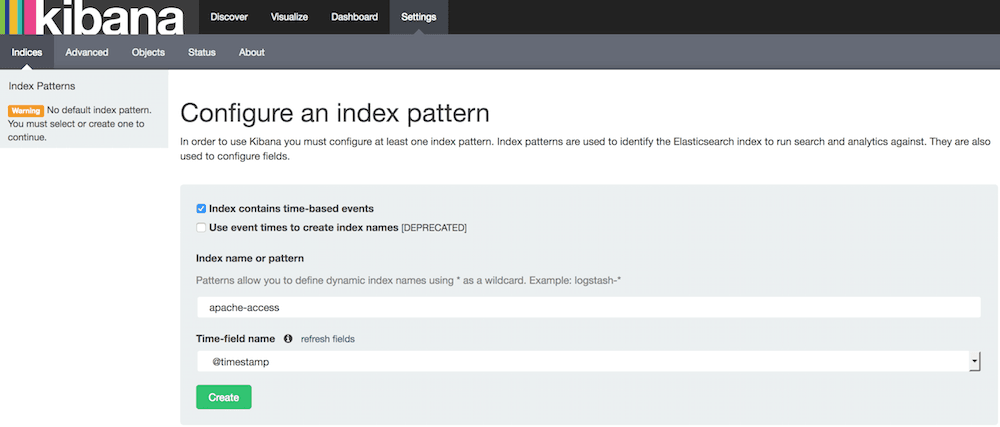
http://192.168.50.40:5601to access Kibana GUI. - Type "apache-access" in "Index name or pattern" field.
- Wait for "Create" button to appear and hit it.
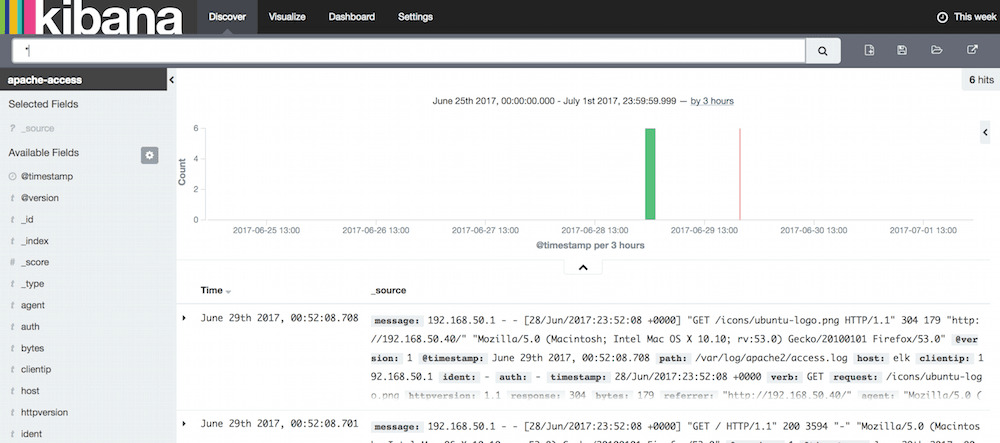
Logs
Click "Discover" menu on top. Right at the end of the menu bar, select "This week" to show logs from.
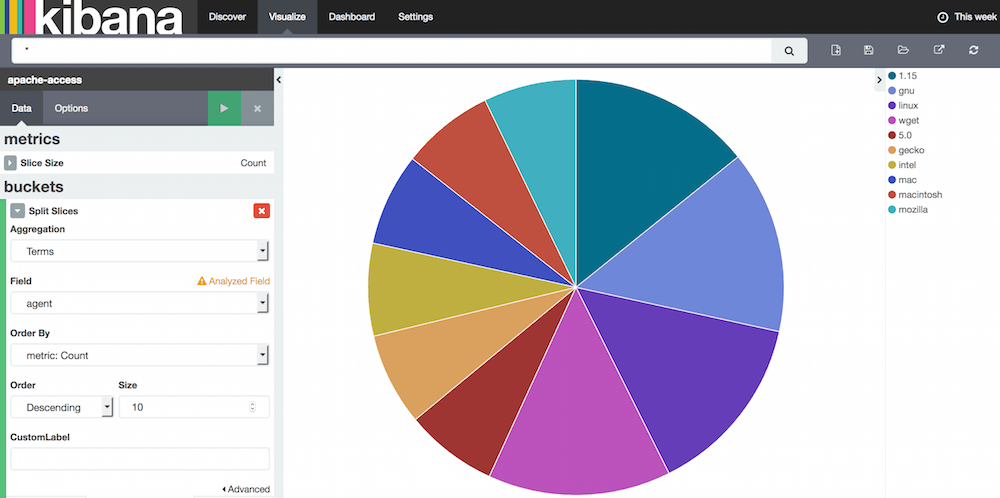
Pie chart
Before you do this, make a lot of test calls to your apache web server either from browsers, terminal etc. so that there are logs to display.
- Click the "Visualize" menu on top.
- Select "Pie chart".
- Select "From a new search".
- Click "Split Slices" on the left.
- Select "Terms" for the "Aggregation" field.
- Select "agent" for the "Field" field.
- Set "Size" to "10".
- Click green play button on top.
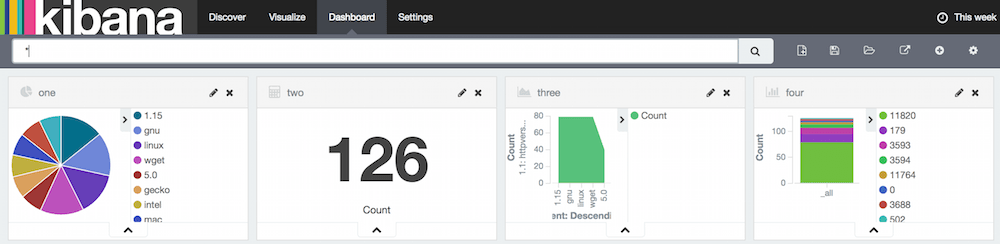
Dashboard
Where you can see your favourite charts. You need to create charts first then save them so that you can display them in dashboard. Good thing about this is, you see real time changes to the graphs.
Elasticsearch content
Content
$ curl -XGET localhost:9200/apache-access/_search?pretty=1
{
  "took": 11,
  "timed_out": false,
  "_shards": {
    "total": 5,
    "successful": 5,
    "failed": 0
  },
  "hits": {
    "total": 2,
    "max_score": 1.0,
    "hits": [
      {
        "_index": "apache-access",
        "_type": "apache_logs",
        "_id": "AVzw9egNH2fJ_S5AJbbc",
        "_score": 1.0,
        "_source": {
          "message": "192.168.50.1 - - [28/Jun/2017:23:07:44 +0000] \"GET / HTTP/1.1\" 200 3594 \"-\" \"Mozilla/5.0 ....",
          "@version": "1",
          "@timestamp": "2017-06-28T23:07:45.269Z",
          "path": "/var/log/apache2/access.log",
          "host": "elk",
          "clientip": "192.168.50.1",
          "ident": "-",
          "auth": "-",
          "timestamp": "28/Jun/2017:23:07:44 +0000",
          "verb": "GET",
          "request": "/",
          "httpversion": "1.1",
          "response": "200",
          "bytes": "3594",
          "referrer": "\"-\"",
          "agent": "\"Mozilla/5.0 (Macintosh; Intel Mac OS X 10.10; rv:53.0) Gecko/20100101 Firefox/53.0\""
        }
      },
      {
        "_index": "apache-access",
        "_type": "apache_logs",
        "_id": "AVzw9egNH2fJ_S5AJbbd",
        "_score": 1.0,
        "_source": {
          "message": "192.168.50.1 - - [28/Jun/2017:23:07:44 +0000] \"GET /icons/ubuntu-logo.png HTTP/1.1\" 304 ....",
          "@version": "1",
          "@timestamp": "2017-06-28T23:07:45.299Z",
          "path": "/var/log/apache2/access.log",
          "host": "elk",
          "clientip": "192.168.50.1",
          "ident": "-",
          "auth": "-",
          "timestamp": "28/Jun/2017:23:07:44 +0000",
          "verb": "GET",
          "request": "/icons/ubuntu-logo.png",
          "httpversion": "1.1",
          "response": "304",
          "bytes": "179",
          "referrer": "\"http://192.168.50.40/\"",
          "agent": "\"Mozilla/5.0 (Macintosh; Intel Mac OS X 10.10; rv:53.0) Gecko/20100101 Firefox/53.0\""
        }
      }
    ]
  }
}
Mapping
$ curl -X GET localhost:9200/_mapping/apache_logs?pretty
{
  "apache-access" : {
    "mappings" : {
      "apache_logs" : {
        "properties" : {
          "@timestamp" : {
            "type" : "date",
            "format" : "strict_date_optional_time||epoch_millis"
          },
          "@version" : {
            "type" : "string"
          },
          "agent" : {
            "type" : "string"
          },
          "auth" : {
            "type" : "string"
          },
          "bytes" : {
            "type" : "string"
          },
          "clientip" : {
            "type" : "string"
          },
          "host" : {
            "type" : "string"
          },
          "httpversion" : {
            "type" : "string"
          },
          "ident" : {
            "type" : "string"
          },
          "message" : {
            "type" : "string"
          },
          "path" : {
            "type" : "string"
          },
          "referrer" : {
            "type" : "string"
          },
          "request" : {
            "type" : "string"
          },
          "response" : {
            "type" : "string"
          },
          "timestamp" : {
            "type" : "string"
          },
          "verb" : {
            "type" : "string"
          }
        }
      }
    }
  }
}